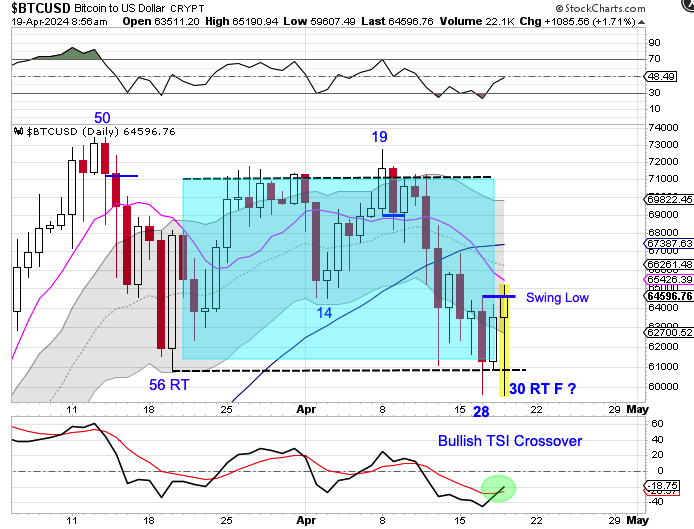
BTC broke below the day 28 low overnight.Friday is day 30, placing BTC in the early part of its timing band for a DCL. BTC appears to have found support at the 61000 level and is in the process of forming a bullish reversal off the 6100. A close back above the 10 day MA will have us label day 30 as an early DCL. BTC is currently in a daily downtrend. BTC will remain in its daily downtrend unless it closes above the upper daily cycle band.
BTC broke bullishly out of its triangle consolidation on Monday. However, it did not deliver bullish follow through on Tuesday.
BTC formed a swing high on Tuesday and was below the upper stem at the time of this post, negating Monday’s breakout. It is possible that BTC was backtesting the 10 day MA. With BTC is in a daily uptrend, a swing low and a close back above the upper stem would indicate a continuation of its daily uptrend and signal a cycle band buy signal. But if BTC delivers bearish follow through and closes below the lower stem, that would signal the daily cycle decline.
BTC is in the process of breaking bullishly out of its triangle consolidation.
BTC is currently in a daily uptrend. A close above the upper stem will indicate a continuation of its daily uptrend and signal a cycle band buy signal.
BTC printed its lowest point on Friday, day 30, placing it in the early part of its timing band for a DCL. BTC should turn the 10 day MA lower in order to complete its DCL. However BTC formed a swing low on Saturday then delivered bullish follow through on Monday. BTC is currently in a daily uptrend. Forming a swing low and a closing back above the to day MA indicates a continuation of its daily uptrend and signals a cycle band buy signal — so we will label day 30 as the DCL.
We discussed that BTC gave a buy signal on January 29th.BTC delivered bullish follow through on Thursday.
BTC had been consolidating around the 50 day MA — until Wednesday. BTC broke bullishly out of consolidation on Wednesday then delivered bullish follow through on Thursday.The new high on day 16 begins to shift the odds toward a right translated daily cycle formation. BTC closed above the upper daily cycle band. on Wednesday.Closing above the upper daily cycle band ends the daily downtrend and begins a daily uptrend.A close above the upper daily cycle band will also indicates that the intermediate cycle low has been set.
BTC printed its lowest point on day 43, placing it in its timing band for a DCL.
BTC formed a swing low on Wednesday then closed above the 10 day MA on Friday to signal day 43 as the DCL. BTC is in the process of delivering bullish follow through as its is breaking above the 50 day MA. In the Weekend Updates I discussed how this is not only a daily cycle low, but potentially the intermediate cycle low as well.
The SEC approved 11 spot bitcoin ETF’s on Wednesday which began trading on Thursday. BTC responded on Thursday by forming a bearish reversal, possibly selling the news.
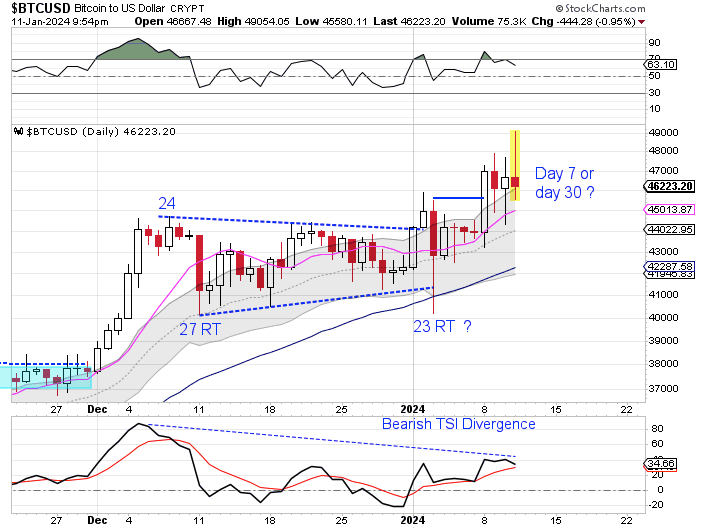
BTChas been volatile over the past 2 weeks causing the status of the daily cycle to not be clear.And the volatility continued on Thursday. Thursday’s bearish reversal calls into question if day 23 was an early DCL.The bearish divergence on the oscillators suggests that Thursday was day 30 for the daily cycle.If so, then a close below the 10 day MA will signal the daily cycle decline.While the status of the daily cycle is not clear, what is clear is that BTC is is currently in a daily uptrend. BTC will remain in its daily uptrend unless it closes below the lower daily cycle band.
One of the strengths of cycle analysis is identifying cycle bottoms. Identifying tops is a bit more challenging, depending if a cycle is forming as a left or right translated cycle. So I began looking for a way to help identify equity cycle tops. Through much trial and error I developed the FAS Buy/Sell Indicator. The Buy/Sell Indicator has out performed the S&P for the past 6 years. Due to the success of the FAS Buy/Sell Indicator, I have added the following in 2023:
The GDX Buy/Sell Indicator
GBTC Buy/Sell Indicator
Below is a summary of results for all 3 Buy/Sell Indicators:
This link will take you to the individual results for all 3 Buy/Sell Indicators.
The Buy/Sell Indicators is available to subscribers to the Weekend Report.
This week I am offering a special 6 week trial subscription, along with the Special Report Report – The Bullish And Bearish Case for Stocks, for $15. Your 6 week trial subscription you will give you full access to the premium site which includes:
1) The Weekend Report, which is posted usually Saturday mornings. It discusses Dollar, Stocks, Gold, Miners, Oil, & Bonds in terms of daily, weekly and yearly cycles – Which includes the Likesmoney Cycle Tracker.
2) The Mid-Week Update. Posted on Wednesday’s is a review of the daily charts for the above mentioned asset classes.
3) The Weekend Updates take a look of the daily & weekly charts of BTC, DAX, Copper, NATGAS & XLE.
4) Weekly Update of the Bullish Percentile Bingo
5) Frequent updates of my proprietary Buy/Sell Indicators for GDX & FAS & GBTC.
The goal of the Weekend Report is to develop an on-going framework of expectations using cycle analysis. Click here for the report and trial subscription.
BTC in the process of forming a triangle consolidation, which is causing our daily cycle count to be uncertain.
Tuesday was either day 43 for the daily cycle or day 16 of a new daily cycle.What is clear is that BTC is currently in a daily uptrend. A bullish break out of consolidation will indicate a continuation of its daily uptrend and signal a cycle band buy signal — in which we would then label day 27 as the DCL.