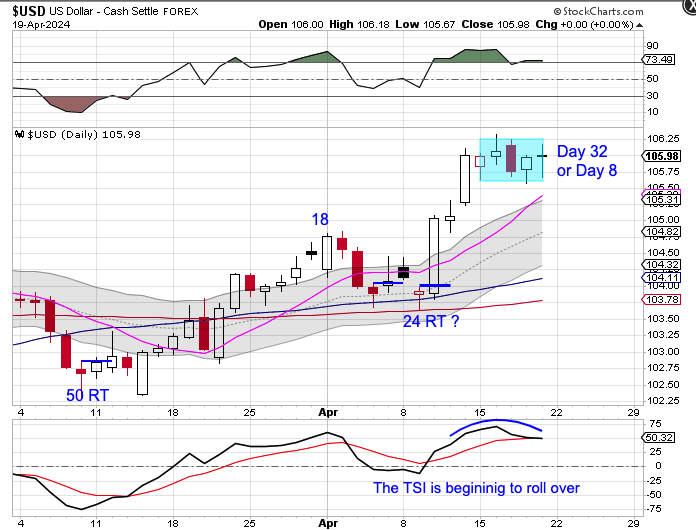
The Dollar

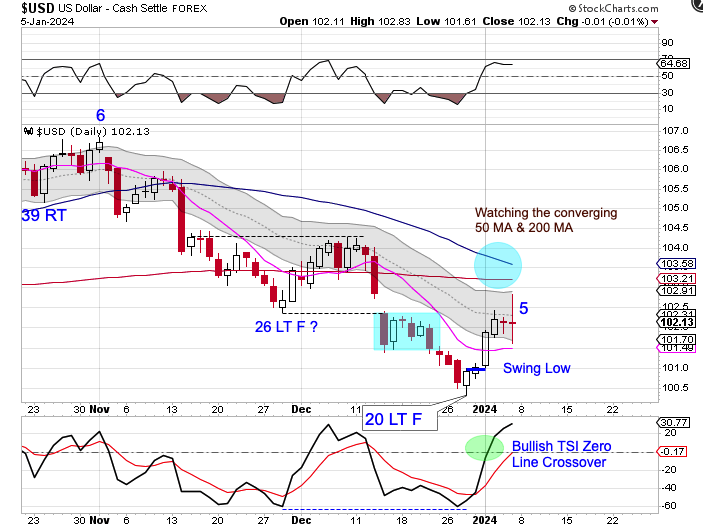
The status of the daily cycle is not clear.

The dollar printed its lowest point on day 17, which was early for a DCL to form. But the bullish reversal off support from the 50 day MA could have triggered a DCL to form. The dollar formed a swing low but was rejected by the declining 10 day MA on Thursday. Any bearish follow through will likely extend the daily cycle decline. The dollar is currently in a daily uptrend. A close back above the 10 day MA will indicate a continuation of its daily uptrend and signal a cycle band buy signal — in which we would then label day 17 as an early DCL.
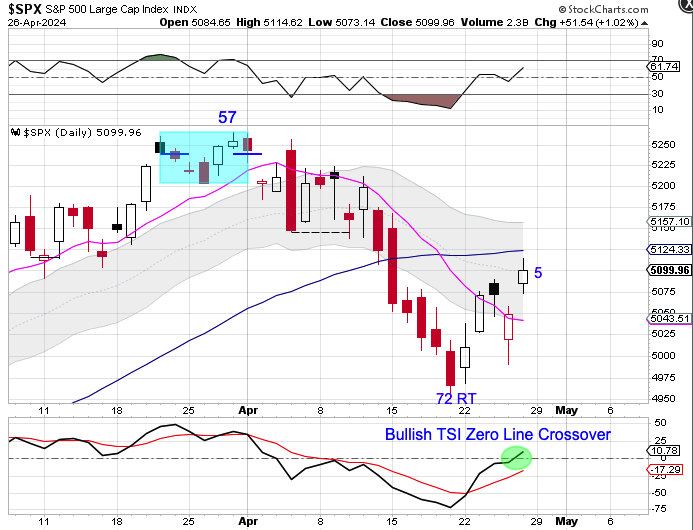
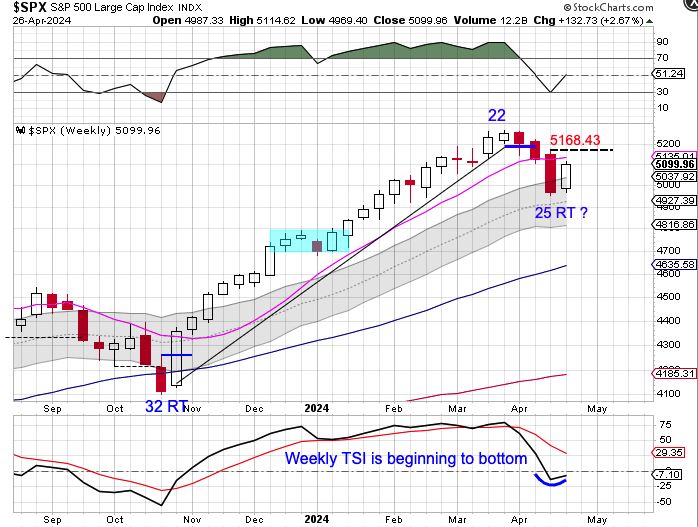
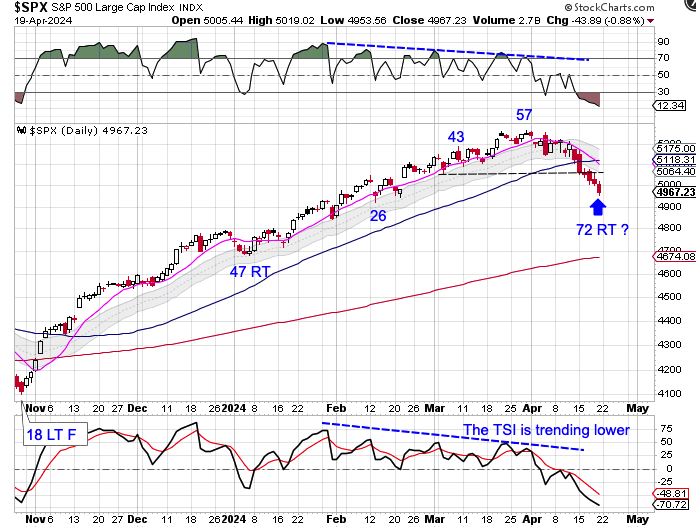
Stocks

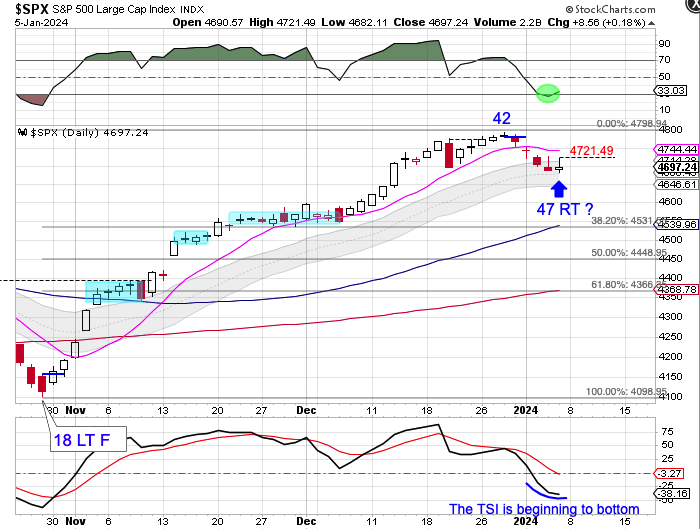
Stocks closed above the 50 day MA on Monday then delivered bullish follow through into Friday.

The new high on day 15 shifts the odds towards a right translated daily cycle formation. Stocks are now stretched above the 10 day MA. Stocks may need to consolidate to allow the 10 day MA to catch up to price. Stocks are currently in a daily uptrend. Stocks will remain in their daily uptrend unless they close below the lower daily cycle band.
The entire Weekend Report can be found at Likesmoney Subscription Services
The Weekend Report discusses Dollar, Stocks, Gold, Miners, Oil, & Bonds in terms of daily, weekly and yearly cycles.
Also included in the Weekend Report is the Likesmoney CycleTracker
For subscribers click here.