YieldMax Rotation Strategy – Update

We discussed YieldMax ETF’s back on 4/1/24. We noted that there are trade offs. One trade off is limiting capital appreciation for consistent monthly dividends. Another trade off to consistent monthly dividends is exposure to full participation of drawdowns.  My YieldMax Rotation Strategy is to use a bullish/bearish crossover of the 10/20 MA’s as the buy/sell signal limits the downside drawdowns while participating in the capital appreciation.

With that said, it is time to take closer look at APLY & TSLY.
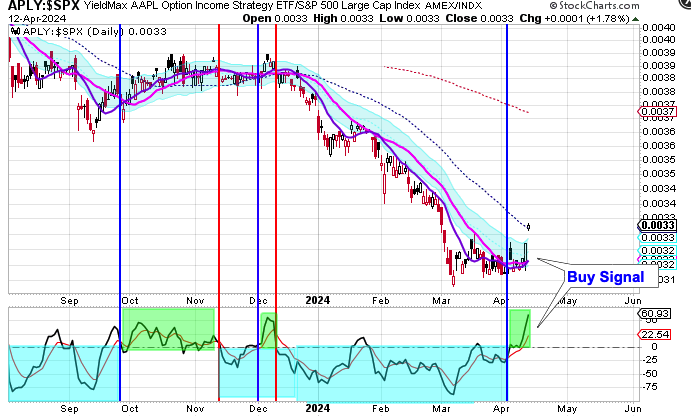
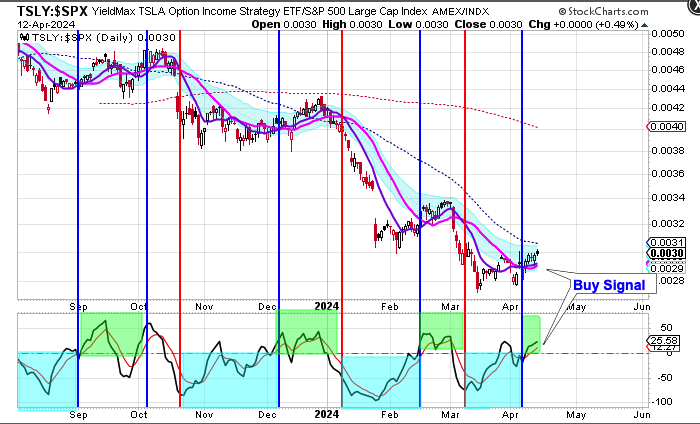
Both APLY and TSLY have been in a downtrend over the past 10 months. Both delivered buy signals this week. APLY averaged a monthly distribution of .4065 over this period which is an annualized 28.6% return. TSLY averaged a monthly distribution of 1.1909 over this period which is an annualized 93.32% return. With both APLY and TSLY delivering buy signals there is the potential for higher yields on the monthly distributions. Combined that with the potential of capital appreciation makes me appreciate these YieldMax ETFs.
YieldMax Rotation Strategy

YieldMax™ ETFs seek to generate monthly income by pursuing options-based strategies on one or more underlying securities. YieldMax™ ETFs aim to harvest compelling yields from assets that are not typically associated with monthly income.

One primary risk is the potential opportunity cost, as the strategy may limit the ETF’s participation in significant market upswings. Another risk is that if the market experiences a sharp and sustained decline, the downside protection provided by the covered call strategy may not fully offset losses.

In other words there are trade offs. One trade off is limiting capital appreciation for consistent monthly dividends. Another trade off to consistent monthly dividends is exposure to full participation of drawdowns.

So let’s look at two of the YieldMax ETF’s: TSLY and CONY.

TSLY is the YieldMax ETF for Tesla, offering a 60.10% distribution rate according the YieldMax.

CONY is the YieldMax ETF for Coin, offering a 66.92% distribution rate according the YieldMax.

TSLY had a 59.84% drawdown so far.

While CONY experienced a 45.9% capital appreciation.

Similar distribution rates but wildly different performance leads us to the obvious conclusion of participating in the rallies and avoiding the drawdowns.

The above chart tracks TSLY performance verses the SPY. Using a bullish/bearish crossover of the 10/20 MA’s as the buy/sell signal limits the downside drawdowns while participating in the capital appreciation.

Similarly, using a bullish/bearish crossover of the 10/20 MA’s on CONYs performance verses the SPY allows for the participation of capital appreciation while limiting downside drawdowns.