YieldMax Rotation Strategy – Update

We discussed YieldMax ETF’s back on 4/1/24. We noted that there are trade offs. One trade off is limiting capital appreciation for consistent monthly dividends. Another trade off to consistent monthly dividends is exposure to full participation of drawdowns.  My YieldMax Rotation Strategy is to use a bullish/bearish crossover of the 10/20 MA’s as the buy/sell signal limits the downside drawdowns while participating in the capital appreciation.

With that said, it is time to take closer look at APLY & TSLY.

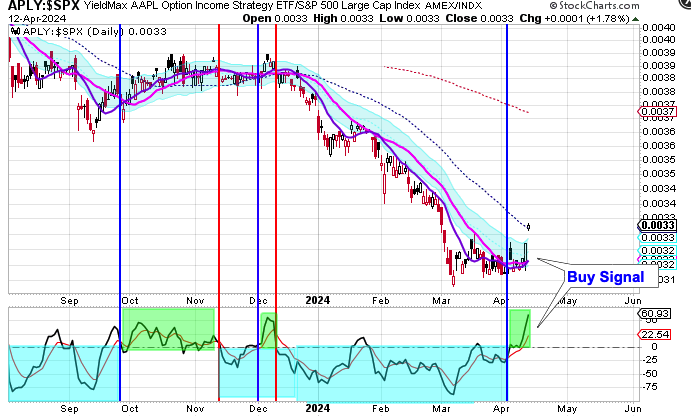
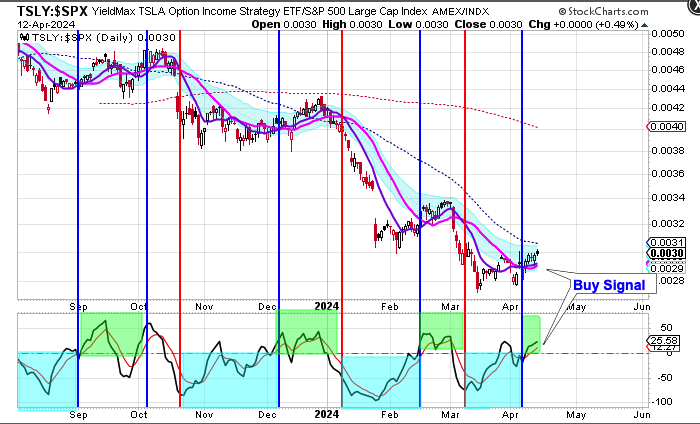
Both APLY and TSLY have been in a downtrend over the past 10 months. Both delivered buy signals this week. APLY averaged a monthly distribution of .4065 over this period which is an annualized 28.6% return. TSLY averaged a monthly distribution of 1.1909 over this period which is an annualized 93.32% return. With both APLY and TSLY delivering buy signals there is the potential for higher yields on the monthly distributions. Combined that with the potential of capital appreciation makes me appreciate these YieldMax ETFs.

The Miners Deliver Buy Signals

0 miner surprise

The Miners formed a swing low on Wednesday.

The Miners printed their lowest point on Tuesday, which was day 26. That places them in their timing band to print a daily cycle low. The Miners delivered buy signals on Wednesday as they reversed higher.

Wednesday’s swing low signals a new daily cycle. Other buy signals that printed on Wednesday include bullish crossovers on both the RSI & TSI and closing above the lower daily cycle band. Wednesday’s swing low also has implications on the longer term intermediate cycle which I plan to discuss in tonights Mid-Week Update.

If you are interested in the Mid-Week Update, I will be running a special through Sunday. I am offering a 6 week trial subscription for $15.

The trial subscription will give you full access to the premium site. Which includes:

1) The Weekend Report, which is posted usually Sunday mornings. It discusses Dollar, Stocks, Gold, Miners, Oil, & Bonds in terms of daily, weekly and yearly cycles – Which includes the Likesmoney Cycle Tracker.

2) The Mid-Week Update. Posted on Wednesday’s– This is a review of the daily and weekly charts for the above mentioned asset classes.

3) The Weekend Updates The Weekend Updates looks of the daily & weekly charts of DAX, GYX, NATGAS & XLE.

4) Weekly Update of the Bullish Percentile Bingo

5) Frequent (just about daily) updates of my proprietary FAS Buy/Sell Indicator

The goal of the Weekend Report is to develop an on-going framework of expectations using cycle analysis.

For the Likesmoney 6 week trial subscription offer click here.

Current subscribers can access the report here.

Buy Signal for Robotics

We discussed on 11/26 how Robotics have entered into a new bull market.
Well Robotics delivered some buy signals on Thursday.

Robotics have been declining into a daily cycle low. They printed their lowest point on Wednesday, closing below the 50 day MA. They formed a swing low on Thursday, closing back above the 50 day MA. This sets up a low risk entry with a stop being placed below Wednesday’s low.

Robotics have been in a daily uptrend prior to declining into Wednesday’s low. The recovery of the 50 day MA looks very similar to the two previous intermediate lows that printed in April and July. And a close back above the upper daily cycle band will re-establish the daily uptrend.