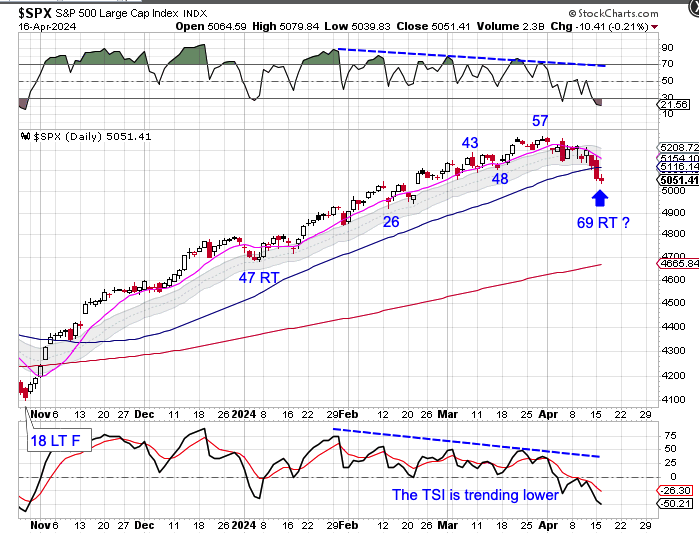
Stocks typically print a daily cycle low every 35 to 45 days. So at 69 days, stocks are overdue for a daily cycle low. Tuesday’s narrow range day eases the parameters for forming a swing low. A break above 5079.84 will form a swing low. Then a close above the 10 day MA will signal the new daily cycle. I plan to discuss in the Weekend Report what stocks need to do to convince me that the pending rally is not going to be a Dead Cat Bounce.
Stocks printed another higher daily cycle high on Thursday.
Thursday was day 41, placing stocks late in its timing band for a daily cycle low. A swing high and close below the 10 day MA will signal the daily cycle decline.And one thing that could send stocks into their daily decline is a rallying dollar.
The dollar formed a bullish reversal on Thursday. The status of the daily cycle is not clear. The dollar is either in the early part of its timing band for a DCL or deep in its timing band for a DCL. A swing low will signal a new daily cycle. We will need to see a close above the 10 day MA to label Thursday as the DCL.
This week I am offering a special 6 week trial subscription, along with the Special Report Report – The Bullish And Bearish Case for Stocks $15. Your 6 week trial subscription you will give you full access to the premium site which includes:
1) The Weekend Report, which is posted usually Saturday mornings. It discusses Dollar, Stocks, Gold, Miners, Oil, & Bonds in terms of daily, weekly and yearly cycles – Which includes the Likesmoney Cycle Tracker.
2) The Mid-Week Update. Posted on Wednesday’s is a review of the daily charts for the above mentioned asset classes.
3) The Weekend Updates take a look of the daily & weekly charts of BTC, DAX, GYX, NATGAS & XLE.
4) Weekly Update of the Bullish Percentile Bingo
5) Frequent updates of my proprietary Buy/Sell Indicators for GDX & FAS & GBTC.
The goal of the Weekend Report is to develop an on-going framework of expectations using cycle analysis. Click here for the report and trial subscription.
Natgas closed back above the 10 day MA to indicate that Thursday was day 7 of the new daily cycle.Having said that, tonight I wanted to look at the longer term, intermediate cycle.
Natgas printed its lowest point last week, which was week 28. That placed Natgas very deep in its timing band for an intermediate cycle low. Natgas has formed a weekly swing low to signal a new intermediate cycle.A close above the 10 week MA will have us label week 28 was the ICL. Long positions can be entered now that a weekly swing low has formed with stops being placed at the week 28 low of 4.50.
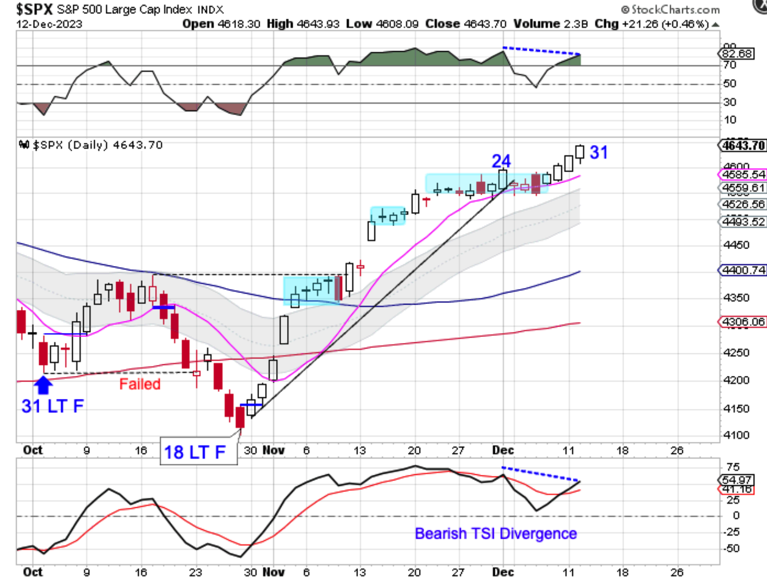
Stocks broke bullishly out of consolidation on Friday and continued higher into Tuesday, ahead of Wednesday’s FOMC meeting.
Tuesday was day 31 for the daily cycle. That places stocks in its timing band for a daily cycle decline. As I motioned in the Weekend Report, breakouts that occur late in the daily cycle are often not sustained. Stocks are currently in a daily uptrend. Stocks will remain in its daily uptrend unless they close below the lower daily cycle band.
Oil broke below the day 29 low on Tuesday to extend the daily cycle decline.
Oil printed its lowest point on Thursday, day 43, placing it deep in its timing band for a DCL. Oil formed a swing low on Friday to signal the new daily cycle. A close above the 10 day MA will have us label day 43 as the DCL. Oil is currently in a daily downtrend. Oil will remain in its daily downtrend unless it closes back above the upper daily cycle band.
The longer term monthly chart shows that the 50 month MA has been a major support/resistance level. In the Weekend Report will discuss the long term support/resistance level and breakdown what that means for oil’s daily, weekly, and yearly cycles.
Gold backtested the 10 day MA on Monday then formed a swing low on Tuesday.However, gold ran into resistance at the 2000 level.
Notice that gold also ran into resistance at the 2000 level back in October. The critical difference this time is that gold is very early in its new daily cycle. That increases the odds that gold can sustain a breakout move above the 2000 level. Gold is currently in a daily uptrend. A breakout above the resistance level will indicate a continuation of its daily uptrend and signal a cycle band buy signal. A longer term analysis of gold is discussed in the Weekend Report. One word to sum up the analysis is Bullish.
This weekend I am going to offer a Black Friday Special.
The Likesmoney Black Friday Sale for New Subscribers
Black Friday Sale — get an extra month on the 3 month subscription – 4 months for $60 — click here.
Black Friday Sale — get an extra two months on the 6 month subscription – 8 months for $100 — click here.
Here is what is included in the Weekend Report Subscription
1) The Weekend Report, which is posted usually Saturday mornings. It discusses Dollar, Stocks, Gold, Miners, Oil, & Bonds in terms of daily, weekly and yearly cycles – and it includes the Likesmoney Combination Cycle Tracker & Trend Tracker.
2) The Mid-Week Update. Posted on Wednesdays is a review of the charts for the above mentioned asset classes.
3) The Weekend Updates, posted on Sundays, take a look of the daily & weekly charts of the Dax, Copper, Natgas & XLE.
4) Weekly Update of the Bullish Percentile Bingo
5) Frequent updates of my proprietary FAS Buy/Sell Indicator
The goal of the Weekend Report is to develop an on-going framework of expectations using cycle analysis.
Oil broke below the day 23 low last Friday to extend the daily cycle decline.
Friday was day 29, placing oil in its timing band for a DCL. Oil rallied on Monday then formed a daily swing low on Tuesday. Oil closed above the 10 day MA on Tuesday to signal day 29 as the DCL. Then oil ran into resistance at the 200 day MA on Wednesday. We will use a close above the 200 day MA to label day 29 as the DCL. Oil is currently in a daily downtrend. Oil ill remain in its daily downtrend unless it closes above the upper daily cycle band.
Monday was a day 16 for the daily equity cycle. The new high on day 16 shifts the odds towards a right translated daily cycle formation. Stock are now getting a bit stretched above the 10 day MA and may need to consolidate to allow the 10 day MA catch up to price.
Stocks are also stretched above the 10 week MA. And stocks are running into resistance at the August high. This is an area where we can see some profit taking after a nice 4 week run up.
In the short term I would advise some caution. But my intermediate view for stocks is bullish. Which is something that I detailed in the recent Weekend Report.
This week I am going to offer an early Black Friday Special.
The Likesmoney Black Friday Sale for New Subscribers
Black Friday Sale — get an extra month on the 3 month subscription – 4 months for $60 — click here.
Black Friday Sale — get an extra two months on the 6 month subscription – 8 months for $100 — click here.
Here is what is included in the Weekend Report Subscription
1) The Weekend Report, which is posted usually Saturday mornings. It discusses Dollar, Stocks, Gold, Miners, Oil, & Bonds in terms of daily, weekly and yearly cycles – and it includes the Likesmoney Combination Cycle Tracker & Trend Tracker.
2) The Mid-Week Update. Posted on Wednesdays is a review of the charts for the above mentioned asset classes.
3) The Weekend Updates, posted on Sundays, take a look of the daily & weekly charts of the Dax, Copper, Natgas & XLE.
4) Weekly Update of the Bullish Percentile Bingo
5) Frequent updates of my proprietary FAS Buy/Sell Indicator
The goal of the Weekend Report is to develop an on-going framework of expectations using cycle analysis.
Last week’s rally has caused the status of the daily cycle to be uncertain. The dollar printed its lowest point the previous Monday. But it was not clear if the previous Monday was day 9 of a failed daily cycle or was 48 LT of a stretched daily cycle — until Monday.
The Dollar formed daily swing high on Monday.
Monday’s swing high caused the dollar to close below the converging 10 day and 50 day MA’s. The dollar is currently in a daily downtrend. Closing below the converging 10 day and 50 day MA’s indicate a continuation of its daily downtrend and signal a cycle band sell signal — which indicates that Monday as day 14 of a failed daily cycle.
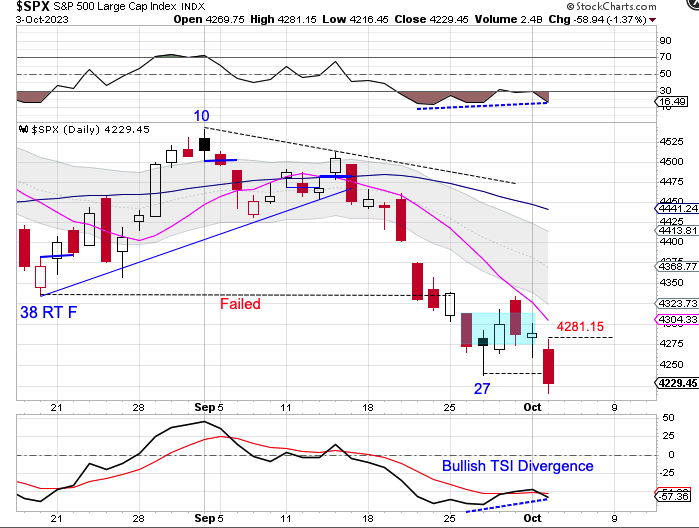
Stocks had been consolidating for the past week before breaking lower on Tuesday. Stocks broke below the day 27 low on Tuesday to extend their daily cycle decline.
This bearish break out of consolidation could trigger a bloodbath phase that could last 5 to 7 days.However,Tuesday was day 31, placing stocks in their timing band for a daily cycle low. A swing low and close back above the 10 day MA will signal the new daily cycle. A break above 4281.18 will form a daily swing low.