The 12/30/23 Weekend Report Preview

Dollar

The dollar broke bearishly out of consolidation the previous Friday to extend the daily cycle decline.  

Breaking bearishly out of consolidation resulted in only a 3 day bloodbath phase with the dollar forming a bullish reversal on Thursday. The dollar then formed a swing low on Friday to signal a new daily cycle. We will need to see a close above the 10 day MA to label Thursday as the DCL. The dollar is currently in a daily downtrend.  The dollar will remain in its daily downtrend unless it closes back above the upper daily cycle band.

Stocks

Stocks formed a swing high on Friday.

Friday was day 43 for the daily cycle. That places stocks deep in its timing band for a daily cycle decline.A close below the 10 day MA will signal the daily cycle decline.Stocks are currently in a daily uptrend. Stocks will remain in its daily uptrend unless they close below the lower daily cycle band. 

The entire Weekend Report can be found at Likesmoney Subscription Services

The Weekend Report discusses Dollar, Stocks, Gold, Miners, Oil, & Bonds in terms of daily, weekly and yearly cycles.
Also included in the Weekend Report is the Likesmoney CycleTracker

For subscribers click here.

Miner Strength

The dollar formed a daily swing low on Thursday.

After Tuesday’s big drop the dollar looked as if it was entering a bloodbath phase, but instead the dollar delivered a bullish surprise on Wednesday. The dollar formed a bullish reversal on Wednesday follow by forming a swing low on Thursday – signaling a possible early DCL.

The monthly chart shows that Tuesday’s decline caused the dollar to tag the 10 month MA – which caused the dollar to rally on Wednesday and form a swing low on Thursday to signal an early DCL. A close above the 10 day MA would have us label day 16 as an early DCL.

But despite this dollar strength, the Miners have managed to rally.  

The Miners printed their lowest point on Friday, day 27, placing them in their timing band for a DCL. The Miners formed a swing low on Tuesday, closing above the 10 day MA. They delivered bullish follow through on Thursday by closing above the 50 day MA so we will label day 27 as the DCL.  The Miners are currently in a daily downtrend.  But a close above the upper daily cycle band will end their daily downtrend and begin a new daily uptrend.

Stocks Recover The 200 Day MA

Stocks broke below the previous DCL Monday, day 14. Breaking below the previous DCL forms a failed daily cycle and extends the intermediate cycle decline.

Breaking below the previous DCL should also trigger a 5 to 7 day bloodbath phase as stocks seek to complete their daily cycle decline. Instead stocks delivered a bullish surprise on Tuesday by closing back above the 200 day MA, which shifts the odds that day 31 was not the DCL.

Forming a swing low and closing above the 200 day MA shifts the odds that Monday was the daily cycle low and the Tuesday was day 1 of the new daily cycle. A close above the 10 day MA will have us label day 45 as the DCL. Then a close above the 50 day MA will shift the odds that Tuesday was not only the DCL but the intermediate cycle low as well.

Stocks Hunting Their DCL

Stocks had been consolidating for the past week before breaking lower on Tuesday. Stocks broke below the day 27 low on Tuesday to extend their daily cycle decline.

This bearish break out of consolidation could trigger a bloodbath phase that could last 5 to 7 days. However, Tuesday was day 31, placing stocks in their timing band for a daily cycle low. A swing low and close back above the 10 day MA will signal the new daily cycle. A break above 4281.18 will form a daily swing low.

Post FOMC

Stocks sold off on Wednesday in response to Powell signaling that there will be one more hike this year. Stocks delivered bearish follow through on Thursday

Stocks broke below the previous daily cycle low on Thursday. Breaking below the previous DCL forms a failed daily cycle and extends the intermediate cycle decline. Breaking below the previous DCL can also trigger a bloodbath phase, which could last 5 to 7 days. And 5 – 7 days would place stocks in their timing band for a DCL.

Bloodbath Phase

When stocks undercut the day 54 low last Friday, the bullish divergence on the oscillators indicated a continuation of the daily cycle decline. Recovery of the breakdown level would have indicated an extended daily cycle low.

When stocks formed a swing low on Monday it looked, in real time, that the undercut-extended daily cycle low scenario was valid. Then stocks were rejected by the breakdown level on Wednesday then delivered bearish follow through on Thursday. Which makes me think we need to label day 54 as the DCL which would make Thursday day 12 of a failed daily cycle. And loosing the breakdown level signals that stocks have entered a bloodbath phase – which can last 5 to 10 days.

Stocks Lose Support

Stocks closed below support on Monday.

Monday was day 52 for the daily equity cycle, placing stocks deep in their timing band for their DCL. A swing low and close back above the support level would signal the DCL. However, closing below the support level could trigger a 5 to 7 day bloodbath phase as stocks hunt their DCL.

In the Weekend Report I take a look at the bigger picture for stocks. I discuss what this decline into this daily cycle low means in terms of the intermediate and yearly cycles. And why I believe that the best opportunity for gains for the year is still in front of us. 

This week I am offering a special 6 Week Trial Subscription offer for $15. Your 6 week trial subscription you will give you full access to the premium site which includes:

1) The Weekend Report, which is posted usually Saturday mornings. It discusses Dollar, Stocks, Gold, Miners, Oil, & Bonds in terms of daily, weekly and yearly cycles – Which includes the Likesmoney Cycle Tracker.

2) The Mid-Week Update. Posted on Wednesday’s is a review of the daily charts for the above mentioned asset classes.

3) The Weekend Updates take a look of the daily & weekly charts of GBTC, DAX, GYX, NATGAS & XLE.

4) Weekly Update of the Bullish Percentile Bingo

Gold Got Hammered

Gold got hammered overnight

Gold dropped 90 points to break below the previous daily cycle low on Monday. Breaking below the previous daily cycle low forms a failed daily cycle which extends the intermediate cycle decline. This could kick off a 5 – 7 bloodbath day phase to print the ICL.

However, gold is in its timing band for both a daily and weekly cycle low. A swing low would signal a new daily cycle and quite possibly the ICl. A break above 1765.70 will form a daily swing low. For those with a higher risk tolerance can use a close above the previous DCL of 1750.10 as a buy signal.

A Major Bearish Day For The Miners

The Miners delivered bearish follow through on Monday by breaking convincingly below the 200 day MA to close 4.29% lower for the day.

This should trigger a bloodbath phase for the Miners that can last 5 to 7 days – which would bring the Miners in the early part of their timing band for a daily cycle low. This just happens to coincide with the dollar beginning a new daily cycle.

The dollar printed a bullish reversal on Monday. This was day 23, placing the dollar in its timing band for a daily cycle low. Monday’s bullish reversal has eased the parameters for forming a swing low. A break above 92.79 will form a swing low to signal a new daily cycle. However, in the Weekend Report we will discuss how the dollar is declining into an intermediate cycle low which give us the expectation for the new daily cycle for the dollar to left translate and fail. A left translated cycle typically peaks by day 8, which aligns with the anticipated bloodbath phase for the Miners. So once the dollar forms a swing high, that will signal a potential DCL for the Miners. Which will be the next major buying opportunity for the Miners.

>>>>>>The Likesmoney Black Friday Sale for New Subscribers <<<<<<

Black Friday Sale  — get an extra month on the 3 month subscription – 4 months for $60 — Black Friday Special has expired 11/30/20

Black Friday Sale  — get an extra two months on the 6 month subscription – 8 months for $100 — Black Friday Special has expired 11/30/20

Here is what is included in the Weekend Report Subscription 

1) The Weekend Report, which is posted usually Saturday mornings. It discusses Dollar, Stocks, Gold, Miners, Oil, & Bonds in terms of daily, weekly and yearly cycles – and it includes the Likesmoney Combination Cycle Tracker & Trend Tracker.

2) The Mid-Week Update. Posted on Wednesdays is a review of the daily charts for the above mentioned asset classes.

3) The Weekend Updates, posted on Sundays, take a look of the daily & weekly charts of the GBTC, Dax, GYX, NATGAS & XLE.

4) Weekly Update of the Bullish Percentile Bingo

5) Frequent updates of my proprietary FAS Buy/Sell Indicator

The goal of the Weekend Report is to develop an on-going framework of expectations using cycle analysis.

Miner Odds


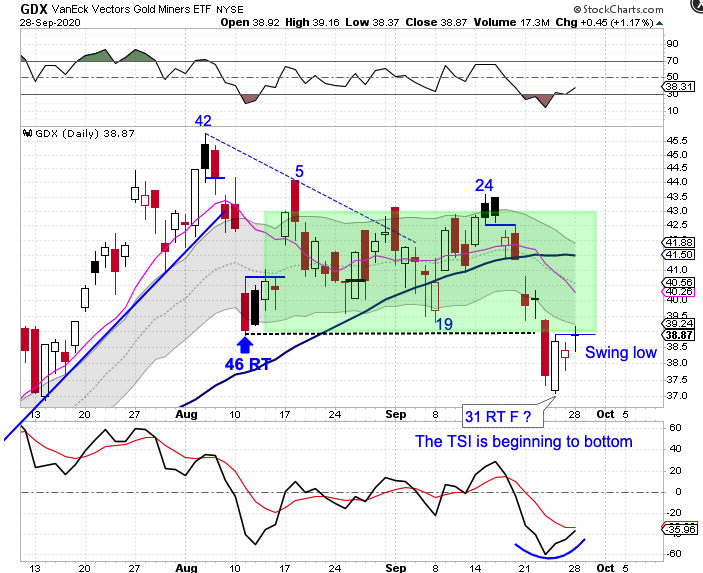
The Miners had been consolidating in a trading box for just over a month. They broke bearishly out of consolidation on Wednesday to form a failed daily cycle. Breaking below the previous DCL should trigger a bloodbath phase to the daily cycle decline that can last 5 to 7 days.  Instead, the Miners delivered a bullish surprise by printing a bullish candle on Thursday.

The Miners formed a swing low on Monday, testing the lower consolidation level. If the Miners are rejected here that should lead to the bloodbath phase. However, at 27 weeks the Miners are very deep in their timing Band for an intermediate cycle low. So if the Miners can close back in the consolidation box then the odds would shift to this not only been a new daily cycle, but a new intermediate cycle as well.