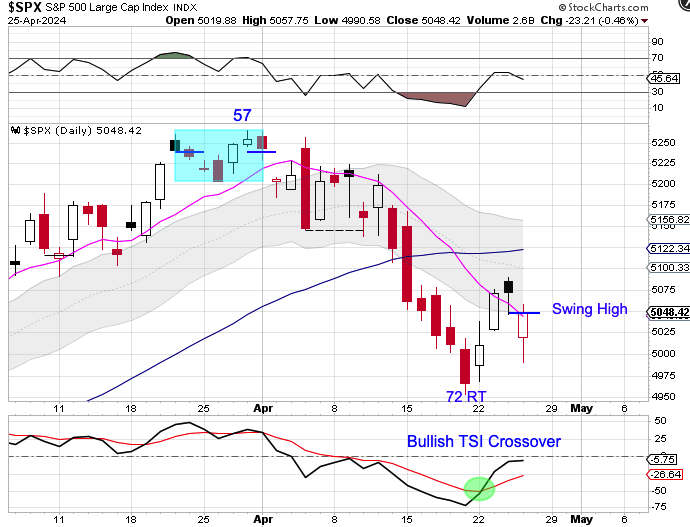
Stocks are currently in a daily downtrend. Forming a swing high below the upper daily cycle band and closing back below the 10 day MA indicates a continuation of its daily downtrend and signals a cycle band sell signal.
Stocks closed above the 10 day MA on Tuesday and then higher again on Wednesday to signal day 72 as the DCL. However, as we discussed here, that the decline into the day 72 DCL caused the 10 day MA to decline sharply. So stocks may need to consolidate to allow the 10 day MA to flatten out before it can turn higher. It appears that stocks are beginning to find their footing on the lower timeframe.
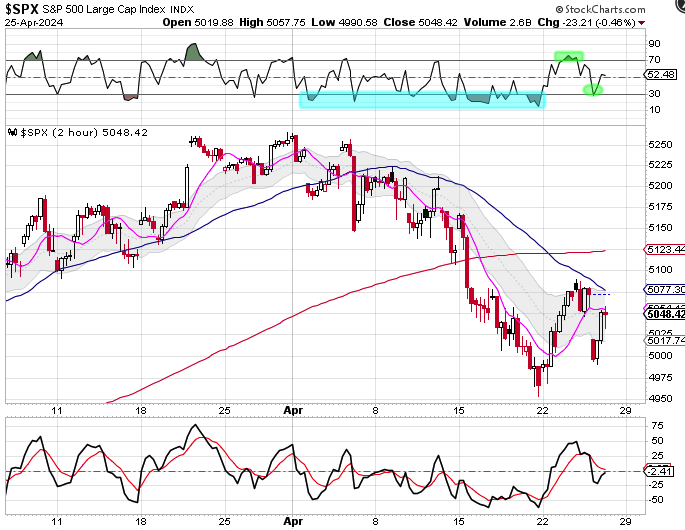
Even through stocks closed lower for the day there is a new pattern of a higher high and higher low emerging on RSI 05. The 2 hour chart showed that stocks ran into resistance at the declining 50 MA and gapped down lower on Thursday. Stocks managed to rally off the daily low to close near the high of the day. Also notice the change in behavior on the 2 hour RSI 05. Prior to Thursday, RSI 05 was characterized by highs below the 70 line and lows below the 30 line. That is beginning to change with a new high above the 70 line and a new low above the 30 line. The next signal that we are watching for is for stocks to close above the 50 MA on the 2 hour chart as further confirmation that day 72 was the DCL.
BTC broke bullishly out of its triangle consolidation on Monday. However, it did not deliver bullish follow through on Tuesday.
BTC formed a swing high on Tuesday and was below the upper stem at the time of this post, negating Monday’s breakout. It is possible that BTC was backtesting the 10 day MA. With BTC is in a daily uptrend, a swing low and a close back above the upper stem would indicate a continuation of its daily uptrend and signal a cycle band buy signal. But if BTC delivers bearish follow through and closes below the lower stem, that would signal the daily cycle decline.
Monday was day 59, placing stocks very deep in their timing band for a DCL. Stocks appear to have begun a distribution phase. A close below the 10 day MA will signal the daily cycle decline. Stock should then go on to turn the 10 day MA lower in order to complete the daily cycle decline.Stocks are currently in a strong daily uptrend. They will remain in their daily uptrend unless they close below the lower daily cycle band.
Stocks formed a swing high on Friday and delivered bearish follow through on Monday and Tuesday.
Stocks have not formed a recognizable DCL since late October. A close below the 10 day MA will signal the daily cycle decline. Stock should then go on to turn the 10 day MA lower and break below the trend line in order to complete the daily cycle decline. Stocks are currently in a strong daily uptrend. They will remain in their daily uptrend unless they close below the lower daily cycle band.
The dollar formed a bearish reversal on Wednesday.
In The Mid-Week Update I discussed how Wednesday’s bearish reversal saw the dollar close back below the converging 50 day MA and 200 day MA. This shifts the odds to a peak on day 8 — which indicates a left translated daily cycle formation.
Well the dollar reversed again on Thursday.
The dollar found support at the rising 10 day MA on Thursday and is in the process of breaking convincingly above the converging 50 day MA and 200 day MA to negate Wednesdays bearish reversal. The dollar is in the process of also breaking above the upper daily cycle band. A close above the upper daily cycle band will end the daily downtrend and begin a daily uptrend.
And this may have caused the Miners to peak.
The Miners formed a bearish reversal on Thursday in response to the dollar’s rally. A swing high and close below the 10 day MA will signal the daily cycle decline.
The dollar broke bullishly above the converging 50 day MA and 200 day MA on Tuesday.
Breaking above these 2 important moving averages on its first try initially looked like a display of relative strength. If the dollar can manage to close above the upper daily cycle band that will end the daily downtrend and begin a new daily uptrend. However the dollar is in the process of forming a rejection candle. The dollar is currently in a daily downtrend. If the dollar forms a swing high below the upper daily cycle band and closes back below the converging 50 day MA and 200 day MA that will indicate a continuation of its daily downtrend and signal a cycle and sell signal. I plan to discuss the longer term intermediate and yearly cycle implications in the Weekend Report.
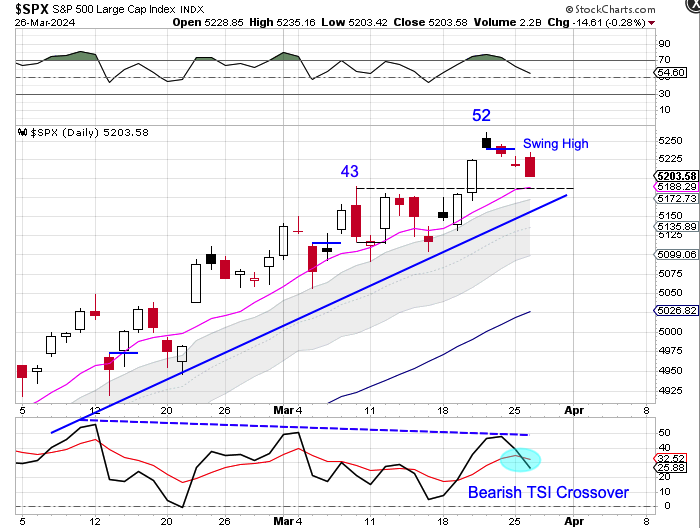
The big picture show us that stocks have not formed a recognizable DCL since late October. Friday was day 43, placing stocks deep in their timing band for a DCL. Friday’s bearish reversal eases the parameters for forming a swing high. A break below 5117.50 will form a swing high. Then a close below the 10 day MA will signal the daily cycle decline. Stocks are currently in a daily uptrend. They will remain in their daily uptrend unless they close back below the lower daily cycle band.
Stocks formed a bearish reversal on Monday followed by a daily swing high on Tuesday.
Tuesday’s swing high saw stocks close below the 5000 level and the 10 day MA. Tuesday was day 26 for the daily equity cycle, placing stocks in the early part of its timing band for a daily cycle low. Closing below the important psychological 5000 level, along with closing below the 10 day MA, signals the daily cycle decline.Stocks are currently in a daily uptrend.Stocks will remain in their daily uptrend unless they close below the lower daily cycle band.
The dollar had been consolidating in between the rising 10 day MA and the 200 day MA — until Tuesday.
The dollar broke bullishly out of consolidation on Tuesday to close above 50 day MA. The dollar went on to close above the 200 day MA on Wednesday.
However the dollar formed a swing high on Thursday then lost the 200 day MA on Friday.A close below the 50 day MA would signal the daily cycle decline. The dollar is currently in a daily uptrend.The dollar will remain in its daily uptrend unless it closes below the lower daily cycle band.
Stocks
Stocks were consolidating in a triangle consolidation — until Friday.
Stocks broke bullishly out of consolidation on Friday.Stocks currently are in a daily uptrend.Breaking bullishly out of consolidation indicates a continuation of the daily uptrend and signals a cycle band buy signal.
The Weekend Report discusses Dollar, Stocks, Gold, Miners, Oil, & Bonds in terms of daily, weekly and yearly cycles. Also included in the Weekend Report is the Likesmoney CycleTracker