Daily Cycle Low

Stocks closed love the 10 day MA on Tuesday.

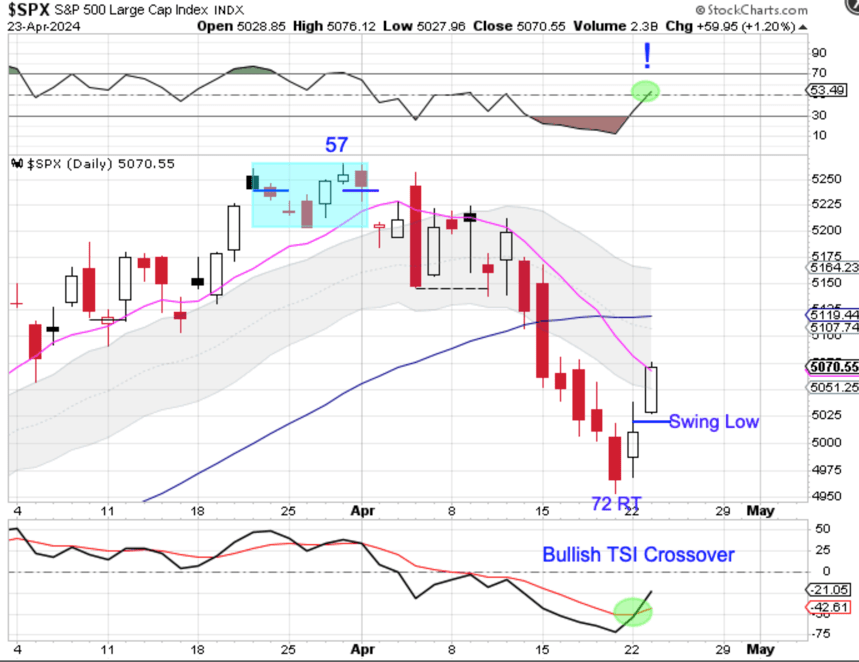
Stocks printed their lowest point on Friday, day 72, placing them very deep in their timing band for a DCL. Stocks formed a swing low on Monday, so closing above the 10 day MA signals day 72 as the DCL. The decline into the day 72 DCL did cause the 10 day MA to decline sharply, so stocks may need to consolidate to allow the 10 day MA to flatten out before it can turn higher.

It is still too early to determine day 72 was also the ICL or if more more DCL is needed to complete the intermediate cycle decline. However, stocks did deliver a bullish signal on Tuesday. Stocks closed above the 50 line on RSI 05 on Tuesday. If RSI 05 goes on to embed in overbought that would indicate that stocks are now in the advancing phase of a new intermediate cycle.

4 thoughts on “Daily Cycle Low

  1. Hello,

    Could you please confirm the inputs for the RSI 05. I have Long length at 25, short length at 13 and signal length at 13 would this be correct ?

    Do you consider RSI or TSI to be a better indicator (I note you use TSI in your weekly reports)

    Thanks

    Eric

    • Hi Eric,
      I favor the TSI (7,4,7), But I do like the both.
      RSI 05 does a nice job of identifying uptrends and downtrends, which confirms our cycle band tool.
      The TSI does a nice job of confirming bottoms and helping to spot tops.
      Here is a link that will show the inputs for RSI.
      LM
      https://postimg.cc/tYFtT0fB

      • Thank you, that’s very helpful.

        I noted your post today that stocks formed a swing high yesterday and note you have drawn a blue line below (as per previous swing high and swing low posts). Could you please clarify how that blue line identifies the swing high please?

        thanks

        [cid:image001.png@01DA9B8E.7D1B3F90]

Leave a comment

This site uses Akismet to reduce spam. Learn how your comment data is processed.