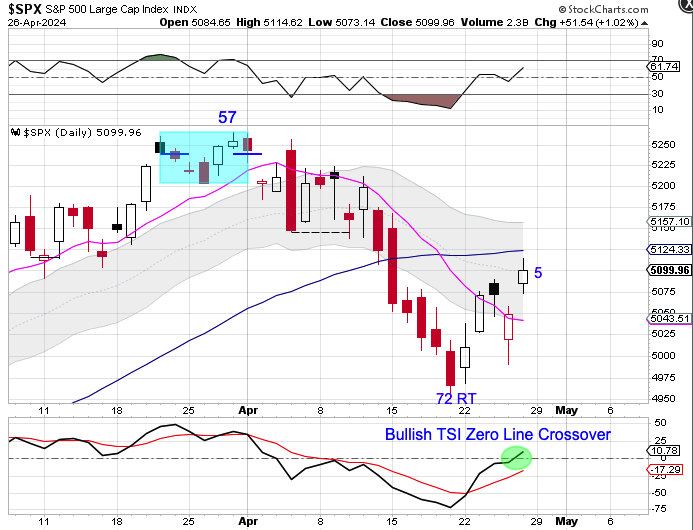
Stocks delivered bullish follow through on Friday confirming day 72 as the DCL. Stocks are now running into resistance at the 50 day MA. The decline into the day 72 DCL caused the 10 day MA to decline sharply, so stocks may need to consolidate to allow the 10 day MA to flatten out before it can turn higher. Stocks are currently in a daily downtrend. They will remain in their daily downtrend unless they close above the upper daily cycle band.
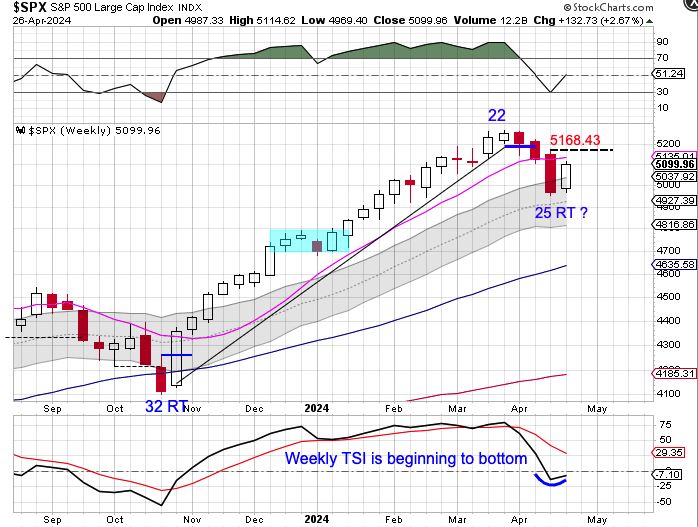
Stocks printed their lowest point on week 25, placing them in their timing band for an ICL. Stocks should turn the 10 week MA lower in order to complete their intermediate cycle decline — but that may not happen. In The Weekend Report I discuss an early signal that indicates the ICL has been set.
The Weekend Report discusses Dollar, Stocks, Gold, Miners, Oil, & Bonds in terms of daily, weekly and yearly cycles. Also included in the Weekend Report is the Likesmoney CycleTracker
Wednesday’s rejection of the converging 50 day MA and 200 day MA set the dollar up for a left translated daily cycle formation. However, everything changed on Thursday.
The dollar found support at the rising 10 day MA on Thursday and closed convincingly above the converging 50 day MA and 200 day MA to negate Wednesday’s bearish reversal. The dollar delivered bullish follow through on Friday, closing above the upper daily cycle band. Closing above the upper daily cycle band ends the daily downtrend and begins a daily uptrend.
This completely changes the narrative for the dollars intermediate, yearly and 3 year cycles — which I breakdown in this week’s Weekend Report.
On Monday we observed that the dollar formed a swing low.
After coiling for 2 days the dollar delivered bullish follow through on Thursday. The dollar is in the process of closing above the 10 day MA so we will label day 50 as the DCL. The dollar should rally enough to turn the 10 day MA higher as it rallies out of its DCL. However, there is significant resistance that the dollar will need to work through, in the form of the 50 day MA and the 200 day MA. Currently the dollar is in a daily downtrend. The dollar will remain in its daily downtrend unless it closes. back above the upper daily cycle band.
Gold continued its multi-month triangle consolidation — until Thursday.
Gold broke bullishly out of consolidation on Thursday then delivered bullish follow through on Friday. Gold closed above the upper daily cycle band on Friday. Closing above the upper daily cycle band ends its daily downtrend and begins a daily uptrend.
A full breakdown of the daily, weekly, and yearly cycles for gold is discussed in the Weekend Report.
This week I am offering a special 6 week trial subscription for $15. Your 6 week trial subscription you will give you full access to the premium site which includes:
1) The Weekend Report, which is posted usually Saturday mornings. It discusses Dollar, Stocks, Gold, Miners, Oil, & Bonds in terms of daily, weekly and yearly cycles – Which includes the Likesmoney Cycle Tracker.
2) The Mid-Week Update. Posted on Wednesday’s is a review of the daily charts for the above mentioned asset classes.
3) The Weekend Updates take a look of the daily & weekly charts of BTC, DAX, Copper, NATGAS & XLE.
4) Weekly Update of the Bullish Percentile Bingo
5) Frequent updates of my proprietary Buy/Sell Indicators for GDX & FAS & GBTC.
The goal of the Weekend Report is to develop an on-going framework of expectations using cycle analysis. Click here for the trial subscription.
BTC formed a swing low on Friday then delivered bullish follow through on Monday, Tuesday, and Wednesday
It initially looked as if day 30 was the DCL. However, the dollar appears to be in the process of forming a DCL, which would be bearish for BTC. Also, there are bearish divergences developing on the oscillators along with BTC forming a slight reversal off the 64000 level which suggests that Wednesday was day 35 – placing it in its timing band for a DCL. BTC is now quite stretched above the 10 day MA. A daily cycle decline would help to allow the 10 day MA to catch up to price. BTC is currently in a daily uptrend. BTC will remain in its daily uptrend unless it closes below the lower daily cycle band.
Tesla printed its lowest point on day 35, placing it in its timing band for a DCL.
Tesla recovered the 10 day MA on Wednesday then delivered bullish follow through on Thursday to signal the new daily cycle. Tesla is currently in a daily downtrend. But a close above the upper daily cycle band will end the daily downtrend and begin a new daily uptrend.
Tesla printed its lowest point on week 14, placing it in the early part of its timing band for a ICL. Tesla formed a weekly swing low to signal a new intermediate cycle. We will need to see a close above the 10 week MA to label week 14 as the ICL. Tesla is currently in a weekly downtrend. Tesla will remain in its weekly downtrend unless it closes back above the upper weekly cycle band.
Over the past 11 years Tesla yearly cycle low formed, on average, every 11 months.
February is month 13, placing Tesla in its timing band for a YCL. Tesla is in the process of forming a bullish monthly reversal, which eases the parameters for forming a monthly swing low, A month swing low and close above the 10 month MA will signal the new yearly cycle.
Summary:
Tesla is in its timing band for a YCL
Tesla is in its timing band for an ICL and formed a weekly swing low.
Tesla has confirmed the new daily cycle.
A close above the triple convergence of the 10 week MA, the 50 week MA and the 200 week MA will confirm the new weekly cycle and signal the new yearly cycle.
I am offering a new service. I will do a cycle analysis of the stock/ETF of your choice for $25.
Included would be a daily, weekly, and yearly chart analysis of the stock/ETF of your choice including a summary and a cycle tracker. Also in included will be a 1 month trial subscription to the Weekend Report.
The goal of the Weekend Report is to develop an on-going framework of expectations using cycle analysis.
It discusses Dollar, Stocks, Gold, Miners, Oil, & Bonds in terms of daily, weekly and yearly cycles. And it also includes the Likesmoney Cycle Tracker.
In addition I post what I call my Weekend Updates
The Weekend Updates cover
BTC
The DAX
Copper
NATGAS
XLE
The proprietary Buy/Sell Indicator for GDX, FAS, and GBTC.
I also post a mid-week update on Wednesday evenings which updates the daily charts from the Weekend Report.
For a cycle analysis of the stock/ETF of your choice and the 1 month trial subscription of the Weekend Report click here. Once you are signed up, I will respond with an email to inquire on the stock/ETF that you would like to have the cycle analysis preformed.
We discussed that BTC gave a buy signal on January 29th.BTC delivered bullish follow through on Thursday.
BTC had been consolidating around the 50 day MA — until Wednesday. BTC broke bullishly out of consolidation on Wednesday then delivered bullish follow through on Thursday.The new high on day 16 begins to shift the odds toward a right translated daily cycle formation. BTC closed above the upper daily cycle band. on Wednesday.Closing above the upper daily cycle band ends the daily downtrend and begins a daily uptrend.A close above the upper daily cycle band will also indicates that the intermediate cycle low has been set.
BTC printed its lowest point on day 43, placing it in its timing band for a DCL.
BTC formed a swing low on Wednesday then closed above the 10 day MA on Friday to signal day 43 as the DCL. BTC is in the process of delivering bullish follow through as its is breaking above the 50 day MA. In the Weekend Updates I discussed how this is not only a daily cycle low, but potentially the intermediate cycle low as well.
We discussed Monday that gold broke above the 2000 resistance level. Gold delivered bullish follow through on Tuesday.
Tuesday was only day 10 for the daily gold cycle. A right translated daily gold cycle can peak past day 20, implying a possible 2 to 3 more weeks before topping.
Which can see gold testing or even breaking above the all time high of 2089.20 during this daily cycle.