The dollar’s rally out of its recent DCL has stalled out at the 104 resistance level.
If the dollar manages to beak above the 104 resistance level we will need to watch the declining 50 day MA. How the dollar reacts to the declining 50 day MA will signal if the 3 year cycle low has been set or is it still out in front. The dollar is currently in a daily downtrend. The dollar will remain in its daily downtrend unless it closes above the upper daily cycle band.
Oil broke below the day 29 low on Tuesday to extend the daily cycle decline.
Oil printed its lowest point on Thursday, day 43, placing it deep in its timing band for a DCL. Oil formed a swing low on Friday to signal the new daily cycle. A close above the 10 day MA will have us label day 43 as the DCL. Oil is currently in a daily downtrend. Oil will remain in its daily downtrend unless it closes back above the upper daily cycle band.
The longer term monthly chart shows that the 50 month MA has been a major support/resistance level. In the Weekend Report will discuss the long term support/resistance level and breakdown what that means for oil’s daily, weekly, and yearly cycles.
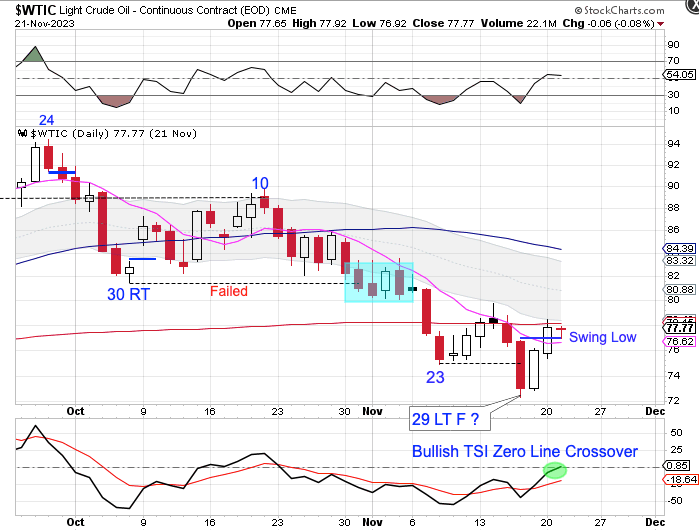
Oil broke below the day 23 low last Friday to extend the daily cycle decline.
Friday was day 29, placing oil in its timing band for a DCL. Oil rallied on Monday then formed a daily swing low on Tuesday. Oil closed above the 10 day MA on Tuesday to signal day 29 as the DCL. Then oil ran into resistance at the 200 day MA on Wednesday. We will use a close above the 200 day MA to label day 29 as the DCL. Oil is currently in a daily downtrend. Oil ill remain in its daily downtrend unless it closes above the upper daily cycle band.
The 200 day MA is a major dynamic support/resistance level for the dollar.
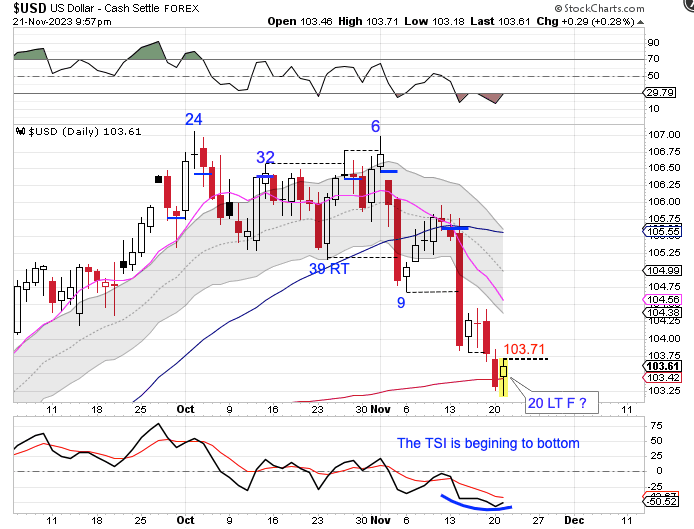
The Dollar formed a bullish reversal of support from the 200 day MA on Tuesday.
Tuesday was day 20, placing the dollar in the early part of its timing band for a DCL. The bullish reversal of support from he 200 day MA signals a new daily cycle. We will use a close above the 10 day MA to label day 20 as the DCL. The Dollar is currently in daily downtrend. The dollar will remain in its daily downtrend unless it closes above the upper daily cycle band.
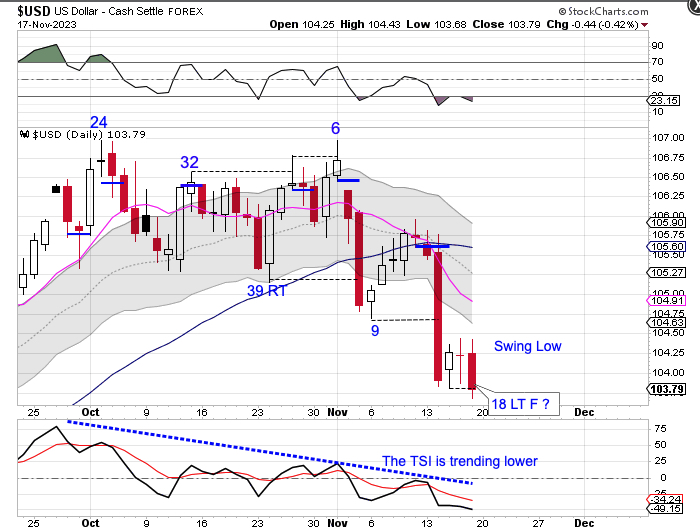
The Dollar formed a daily swing high on Monday. The dollar then delivered a bearish follow through into Friday to signal the daily cycle decline.
The dollar printed its lowest point on Friday, day 18, placing it in the early part of its timing band for a DCL.We will be watching the rising 200 day MA as a possible support for a DCL to form. A swing low and a close back above the 10 day MA will signal the DCL. The dollar is currently in a daily downtrend. The dollar will remain in its daily downtrend unless it closes above the upper daily cycle band.
Stocks
Stocks gapped higher on Tuesday then consolidated Wednesday, Thursday, andFriday.
Stocks are now stretched above the 10 day MA. Stocks may need to continue to consolidate to allow the 10 day MA to catch up to price. Stocks are currently in a daily uptrend. Stocks will remain in their daily uptrend unless they close below the lower daily cycle band.
This week I am going to offer an early Black Friday Special.
The Likesmoney Black Friday Sale for New Subscribers
Black Friday Sale — get an extra month on the 3 month subscription – 4 months for $60 — click here.
Black Friday Sale — get an extra two months on the 6 month subscription – 8 months for $100 — click here.
Here is what is included in the Weekend Report Subscription
1) The Weekend Report, which is posted usually Saturday mornings. It discusses Dollar, Stocks, Gold, Miners, Oil, & Bonds in terms of daily, weekly and yearly cycles – and it includes the Likesmoney Combination Cycle Tracker & Trend Tracker.
2) The Mid-Week Update. Posted on Wednesdays is a review of the charts for the above mentioned asset classes.
3) The Weekend Updates, posted on Sundays, take a look of the daily & weekly charts of the Dax, Copper, Natgas & XLE.
4) Weekly Update of the Bullish Percentile Bingo
5) Frequent updates of my proprietary FAS Buy/Sell Indicator
The goal of the Weekend Report is to develop an on-going framework of expectations using cycle analysis.
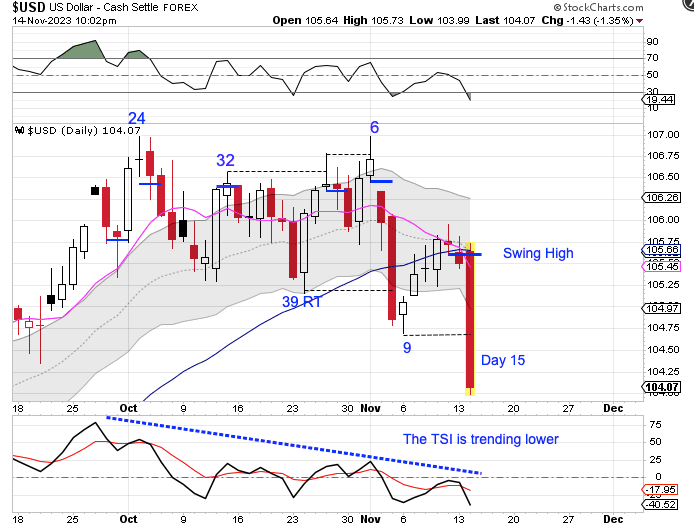
On Monday we discussed with the dollar in a daily downtrend, Monday’s swing high and close below the converging 10 day MA and 50 day MA indicates a continuation of its daily downtrend and signals a cycle band sell signal.
The dollar delivered bearish follow through on Tuesday.
The dollar was clearly rejected by the converging 10 day MA and 50 day MA on Tuesday to close 1.35% down for the day, signaling the daily cycle decline. At 15 days the dollar should trend lower for another 2 – 3 weeks before printing its DCL. However,the previous daily cycle was rather stretched at 39 days and the dollar is currently very oversold. So it is possible to see a shortened daily cycle here, which would help to balance out the cycle counts. In the Weekend Report I plan to break down what this means for the weekly cycle, yearly cycle and the 3 year cycle. But I will give you a hint – its bearish.
This week I am going to offer an early Black Friday Special.
The Likesmoney Black Friday Sale for New Subscribers
Black Friday Sale — get an extra month on the 3 month subscription – 4 months for $60 — click here.
Black Friday Sale — get an extra two months on the 6 month subscription – 8 months for $100 — click here.
Here is what is included in the Weekend Report Subscription
1) The Weekend Report, which is posted usually Saturday mornings. It discusses Dollar, Stocks, Gold, Miners, Oil, & Bonds in terms of daily, weekly and yearly cycles – and it includes the Likesmoney Combination Cycle Tracker & Trend Tracker.
2) The Mid-Week Update. Posted on Wednesdays is a review of the charts for the above mentioned asset classes.
3) The Weekend Updates, posted on Sundays, take a look of the daily & weekly charts of the Dax, Copper, Natgas & XLE.
4) Weekly Update of the Bullish Percentile Bingo
5) Frequent updates of my proprietary FAS Buy/Sell Indicator
The goal of the Weekend Report is to develop an on-going framework of expectations using cycle analysis.
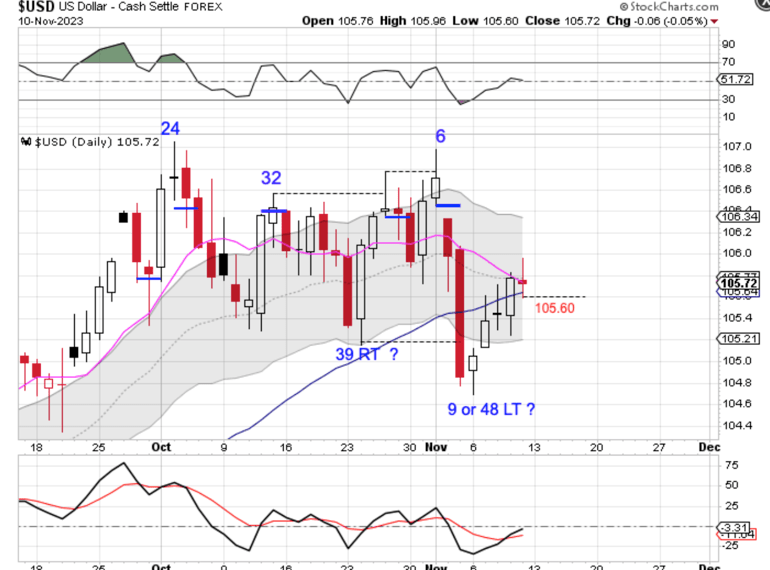
Last week’s rally has caused the status of the daily cycle to be uncertain. The dollar printed its lowest point the previous Monday. But it was not clear if the previous Monday was day 9 of a failed daily cycle or was 48 LT of a stretched daily cycle — until Monday.
The Dollar formed daily swing high on Monday.
Monday’s swing high caused the dollar to close below the converging 10 day and 50 day MA’s. The dollar is currently in a daily downtrend. Closing below the converging 10 day and 50 day MA’s indicate a continuation of its daily downtrend and signal a cycle band sell signal — which indicates that Monday as day 14 of a failed daily cycle.
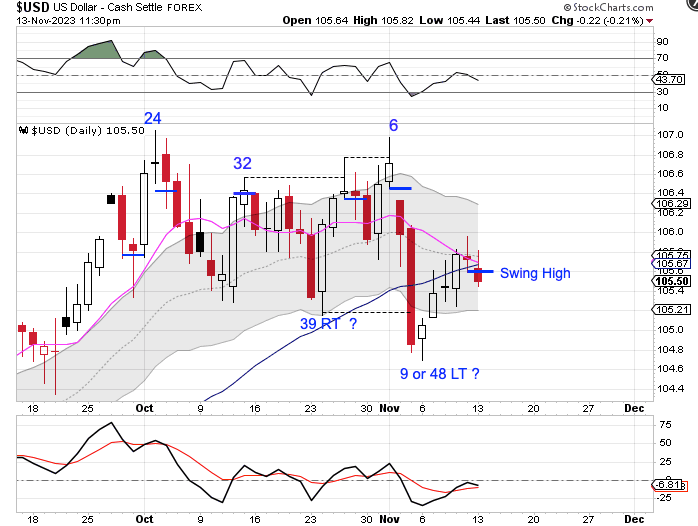
This week’s rally has caused the status of the daily cycle to be uncertain.
The dollar closed back above the 50 day MA on Thursday, but ran into resistance at the declining 10 day MA on Friday. A close back above the 10 day and 50 day MA would have us label Monday as 48 LT. However the dollar is currently in a daily downtrend. If the dollar forms a swing high below the upper daily cycle band and closes below both the 50 day MA and 10 day MA that will indicate a continuation of its daily downtrend and signal a cycle band sell signal — which would indicate that Friday was day 13 of a failed daily cycle. A break below 105.60 will form a swing high.
Stocks
Stocks have been consolidating above the 50 day MA — until Friday.
Stocks broke bullishly out of consolidation on Friday to form a higher daily cycle high. That aligns with stocks currently being in a daily uptrend. Breaking bullishly out of consolidation indicates a continuation of the daily uptrend and signals a cycle band buy signal.
The Weekend Report discusses Dollar, Stocks, Gold, Miners, Oil, & Bonds in terms of daily, weekly and yearly cycles. Also included in the Weekend Report is the Likesmoney CycleTracker
On Thursday we discussed how stocks were rejected by the 50 day MA the previous 2 times that they tested it. And closing above the 50 day MA would be a change of character. Stocks closed above the 50 day MA on Friday
Closing above the 50 day MA on Friday will have us label day 18 as an early DCL. Stocks also closed back above the upper daily cycle band on Friday. Closing back above the upper daily cycle band ends the daily downtrend and begins a new daily uptrend. Closing back above the upper daily cycle band also signals that the ICL has been set.
In The Weekend Report I will further discuss what this means for both the daily cycle and the intermediate cycle — and the yearly cycle. And what expectations we will have based on cycle framework. But let me give you a hint — its bullish.
This week I am offering a special 6 week trial subscription to the Weekend Report for $15. Your 6 week trial subscription you will give you full access to the premium site which includes:
1) The Weekend Report, which is posted usually Saturday mornings. It discusses Dollar, Stocks, Gold, Miners, Oil, & Bonds in terms of daily, weekly and yearly cycles – Which includes the Likesmoney Cycle Tracker.
2) The Mid-Week Update. Posted on Wednesday’s is a review of the daily charts for the above mentioned asset classes.
3) The Weekend Updates take a look of the daily & weekly charts of GBTC, DAX, Copper, Natgas & XLE.
4) Weekly Update of the Bullish Percentile Bingo
5) Frequent updates of my proprietary FAS Buy/Sell Indicator
The goal of the Weekend Report is to develop an on-going framework of expectations using cycle analysis. Click here for the 6 week trial subscription.
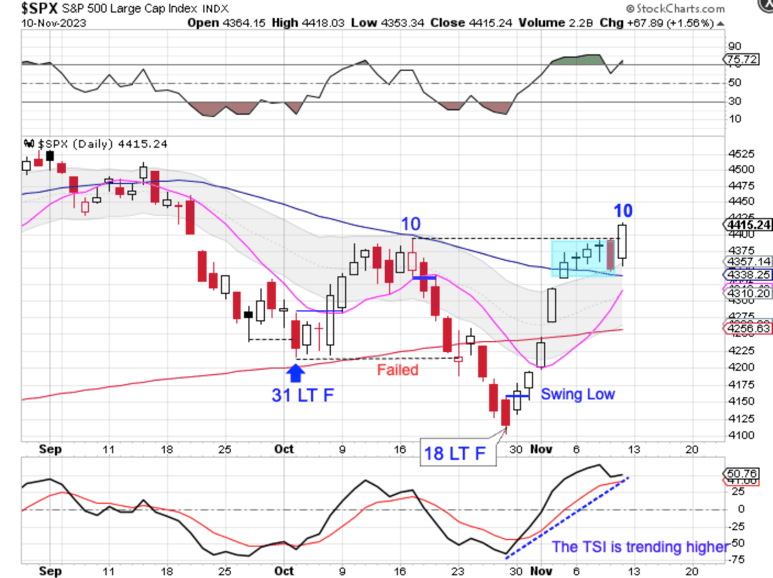
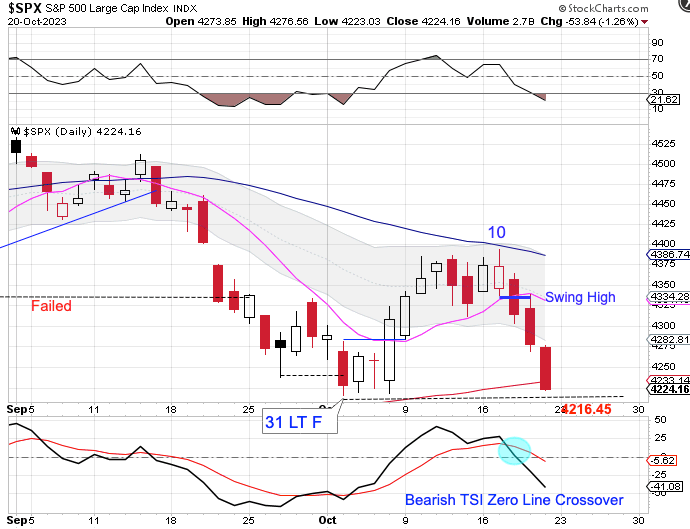
Stocks formed a daily swing high on Wednesday then delivered bearish follow through into Friday, closing below the 200 day MA.
The peak on day 10 sets stocks up for a left translated daily cycle formation. Stocks are currently in a daily downtrend. Closing below the 200 day MA indicates a continuation of its daily downtrend and signals a cycle band sell signal. A break below the previous DCL of 4216.45 will form a failed daily cycle.
A failed daily cycle will extend the intermediate cycle decline. In the Weekend Report I discuss the implications of this and what it means for the yearly cycle and the 4 year cycle.