Potential Failed Breakout

Stocks formed a bearish reversal on Monday followed by a swing high on Tuesday.

The rally out of the day 30 low looked, in real time, as if stocks printed an early DCL. However, stocks did not deliver any bullish follow through this week. Instead of turning the 10 day MA higher, stocks lost the 10 day MA on Tuesday to close back below the breakout level. That, along with the bearish divergence on the oscillators, indicate that stocks did not complete their daily cycle decline.

It’s Getting Late

Monday was day 33 for the daily cycle. At 33 days, stocks should be seeking out their DCL, instead stocks rallied on Monday.

The bearish divergence on the oscillators point to a pending daily cycle decline.

It is really too late in the daily cycle for any bullish follow through to be sustained. A more likely event would be a marginal break to a new daily cycle high before stocks roll over into their daily cycle decline.

Miner Breakout

While we do not know if this will lead to a sustained breakout or not, the Miners did close out the week back above the 38.50 level.

We need to acknowledge the bearish divergence developing on the oscillators. And a close below 38.50 should still be used as the stop. The Miners are currently in a daily uptrend.   They will remain in their daily uptrend unless they close below the lower daily cycle band. 

Bearish Divergence

Stocks broke out to a new daily cycle high on Monday.

Monday was day 36 for the daily cycle, placing stocks in their timing band for a daily cycle low. The bearish divergence on the oscillators has me suspicious that any breakout will be reversed to send stocks into their daily cycle decline. At this point a close below the 10 day MA will signal the daily cycle decline. And a close below Tuesday’s low of 4118.38 would be a lower low, confirming the daily cycle decline.

Bullish Reversal

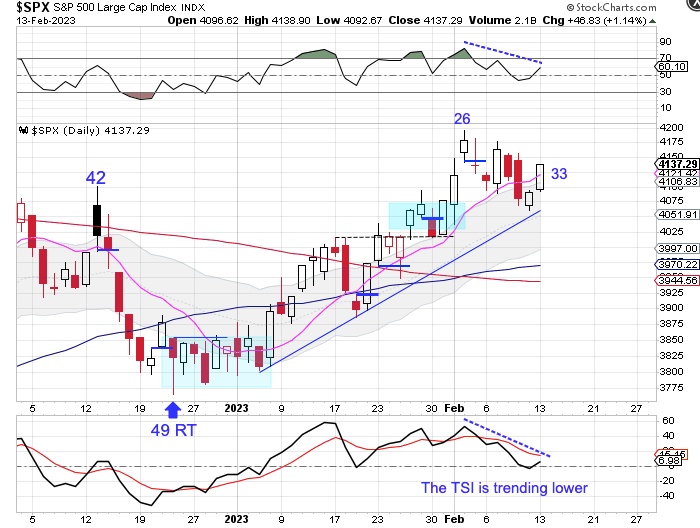
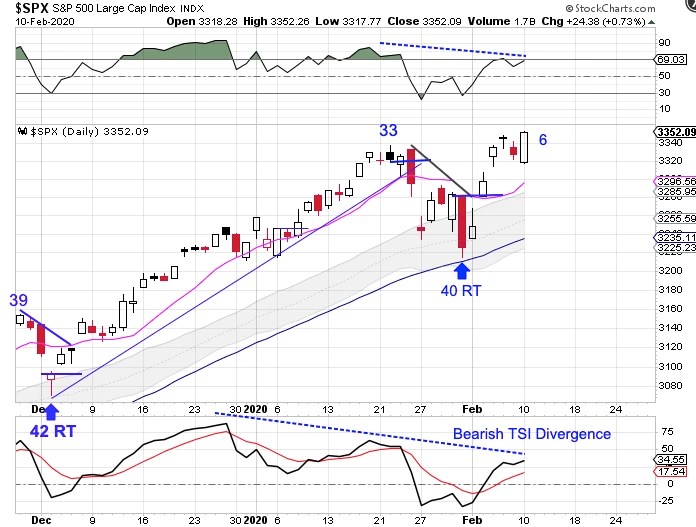
Stocks printed a huge bullish reversal on Tuesday.

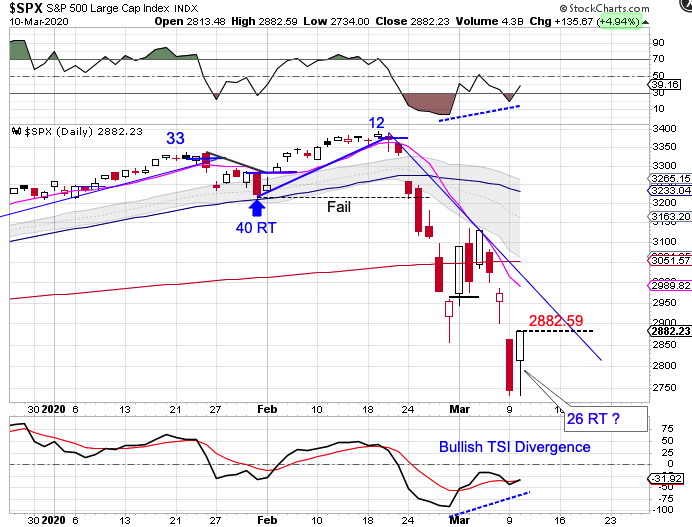
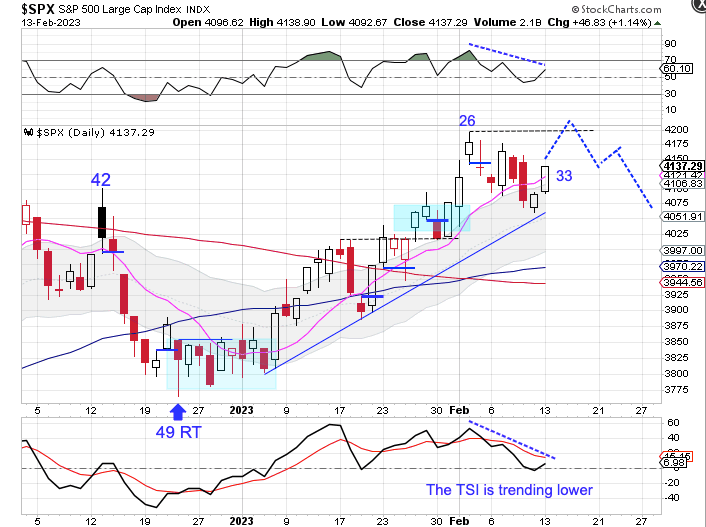
Stocks had a huge day, gaining nearly 5% on the day. There are bullish divergences on the oscillators which we often see at cycle lows. Tuesday was only day 26 for the daily equity cycle, which is early to expect a daily cycle low. But given the extreme sentiment I think that it is possible that stocks printed an early daily cycle low, which may also turn out to be their intermediate cycle low. We need to see a swing low and a close above the declining trend line to confirm the new daily cycle. Since Stocks did print a lower low on Tuesday, the earliest that a swing low can form would be on Wednesday. But for those with a higher risk tolerance that do not want to wait on a trend line break can enter long positions now with a stop place below Tuesday’s low.

Bonds seem to be confirming the daily cycle low for stocks.

Bonds have been trading inversely to stocks recently. Bonds peaked on Monday and formed a swing high on Tuesday. Where stocks closed almost 5% higher on Tuesday, bonds closed over 5% lower on Tuesday to signal their daily cycle decline. Bonds should go on to break below the blue trend line in order to complete their daily cycle decline.

Potential False Weekly Breakout Developing

Stocks appear to be developing a false weekly breakout.

Stocks have been contained by resistance at the 3330 over the past several weeks. This week stocks broke cleanly above the 3330 level. But already appear to be developing an upper shadow on the weekly candle. This is week 19 for the intermediate equity cycle, placing stocks in their timing band for an intermediate cycle low. There are bearish divergences developing on the weekly oscillators that often accompany a cycle top. A close below the 3330 level would form a bearish weekly reversal which would indicate the intermediate cycle decline.

And as we discussed on Monday, there is a potential Black Swan Event developing in China due to Coronavirus. And the economic impact of the Coronavirus can help to intensify the pending intermediate cycle decline.

Time to Dance Close to The Exit

February is month 14, placing stocks late in their timing band for a yearly cycle decline. Stocks are also in their timing band for a weekly (intermediate) cycle decline. So we need to be on “our toes” for a left translated daily cycle formation to develop that will trigger an intermediate and possibly yearly cycle decline.

Despite closing at all time highs, there are bearish divergences developing which often herald a cycle decline. And with a potential Black Swan Event developing in China with Massive Manufacturing Disruptions Due to Coronavirus it looks like its time to be dancing close to the exit.

Bearish Divergence

Stocks broke out again to new highs on Monday.

Monday was day 27 for the daily cycle, placing stocks 3 days shy of their timing band for a daily cycle low. There are bearish divergences developing on the the money flow and oscillators which often precede a cycle decline. A break of the daily cycle trend line will signal of the daily cycle decline.

Miner Support


The Miners printed a bullish reversal off of support from the 10 day MA on Thursday to print a new daily cycle high.

Thursday was day 21 for the daily Miner cycle, placing the Miners in the early part of its timing band for a daily cycle low. The new high on day 21 assures us of a right translated daily cycle formation. However there are bearish divergences that are emerging on the oscillators, which often precede a cycle decline. A swing high accompanied by a close below the 10 day MA will signal the daily cycle decline. The Miners have established a daily uptrend. They will remain in their daily uptrend as long as they do not close below the lower daily cycle band.

Miners Suspicion

The Miners printed their lowest point on Friday, following the peak on day 11. Friday was day 18, placing the Miners in the early part of its timing band for a daily cycle low.

The Miners formed a swing low and closed above the 10 day MA on Tuesday to indicate a new daily cycle. So while the Miners are in the early stages of a new daily cycle they are on week 20 for their intermediate cycle. And allowing 6 to 8 weeks for the new daily cycle to run its course will bring the Miners deep in their timing band for an intermediate cycle low. Therefore we are suspicious that this new daily cycle will left translate and failed to usher in the intermediate cycle low.

The daily chart shows a bearish divergence on the oscillators at (1) and that the Miners closed below the lower daily cycle band at (2). The weekly chart, which I will detail in the Weekend Report, shows that last week the Miners formed a weekly swing high and closed below the 10 week MA. The these are all indicators that the Miners have begun their intermediate cycle decline.