 http://imageshack.com/a/img849/529/94cz.jpg
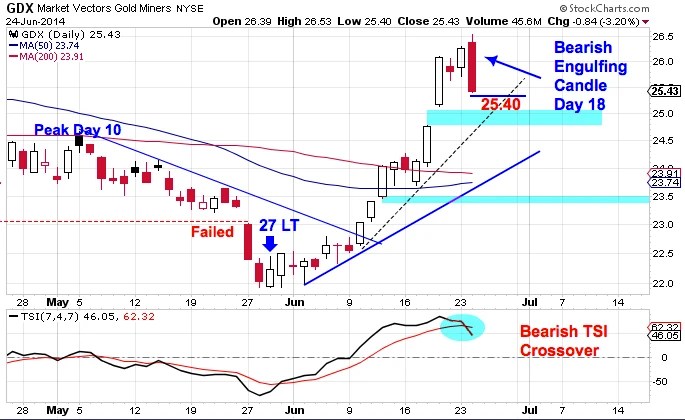
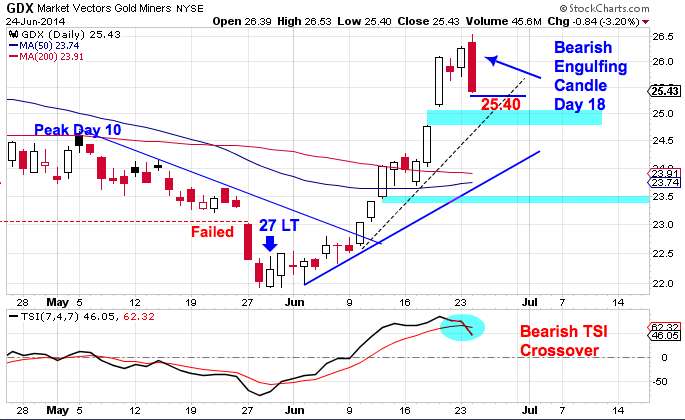
We discussed here on Tuesday that the Miners printed a huge bearish engulfing candle and lost a whopping 3.24% on the day. (Below is Tuesday’s chart)
 http://imageshack.com/a/img841/6563/f79mw.jpg
Tuesday the Miners entered the timing band for a daily cycle low. Following the bearish reversal we needed to see 2 things to confirm the daily cycle decline:
1) A break below 25.40 to form a swing high.
2) A break of the (solid blue) daily cycle trend line to confirm the daily cycle decline.
So far neither has happened.
 http://imageshack.com/a/img823/3678/02qlt.jpg
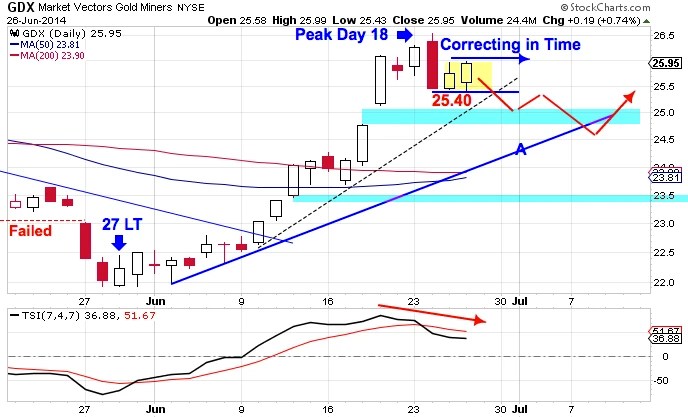
This daily cycle decline is beginning to look more like a correction in time instead of price. This sideways consolidation is shortening the gap between price and the daily cycle trend line. And for each passing day this continues increases the probability of this correction only filling the first gap but not the second.

Leave a reply to Jim (@hamvestor) Cancel reply