
Pre-Summary
Stocks extended their daily cycle decline by closing below the lower daily cycle band. This structural change ended the daily uptrend, began a daily downtrend, and marked the beginning of the next Intermediate Cycle Decline.
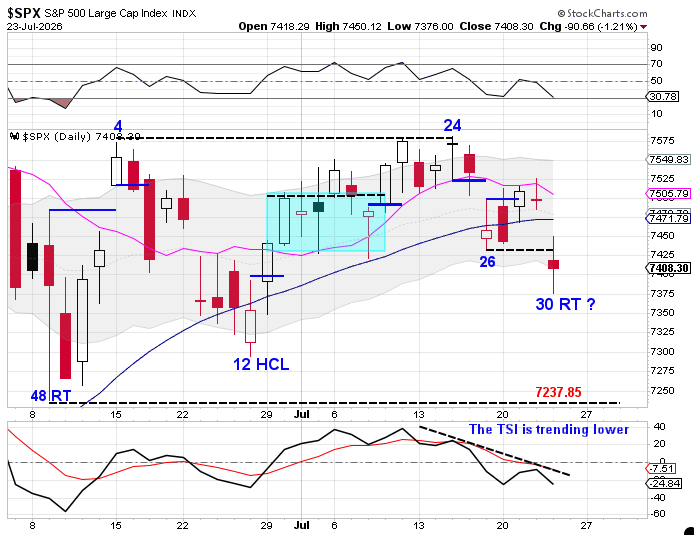
Stocks entered the Daily Cycle Low timing band on Day 26 after closing below the 50-day moving average. A swing low formed on Monday, followed by a close back above the 50-day moving average on Tuesday, suggesting the daily cycle decline might be ending.
Instead, Stocks remained trapped between the 50-day moving average and the 10-day moving average until Thursday. A gap lower broke below the Day 26 low, pushed price back below the 50-day moving average, and extended the daily cycle decline.
More importantly, Stocks closed below the lower daily cycle band.
Closing below the lower daily cycle band signals a structural change in trend. The daily uptrend has ended and a daily downtrend has begun. This change in trend also marks the beginning of the next Intermediate Cycle Decline, which we’ll examine in detail in this weekend’s subscriber report.
Stocks are now stretched below the 10-day moving average. Rather than continuing lower in a straight line, markets often need time to consolidate and allow the 10-day moving average to catch up to price. That consolidation will help determine where the next Daily Cycle Low develops within the broader Intermediate Cycle Decline.
Cycle Study
Trend Changes Before Cycle Lows
Cycle analysis separates trend from cycle condition.
A market can be searching for a Daily Cycle Low while remaining in either an uptrend or a downtrend.
Closing below the lower daily cycle band ends the daily uptrend and begins a daily downtrend. It also signals the beginning of the next Intermediate Cycle Decline.
The next objective is no longer simply identifying a Daily Cycle Low. Instead, we’ll be monitoring the evidence that eventually signals the Intermediate Cycle Low and the next opportunity for the longer-term trend to resume.
 Cycle Trading
Leave a comment