Pre-Summary
Semiconductors have led the broader market throughout June, as shown by the SMH:SPY ratio chart, which compares the performance of semiconductor stocks to the S&P 500. From a cycle perspective, that leadership remains intact. However, the recent pullback has brought the ratio to an important support level that could determine whether semiconductors continue leading the market.
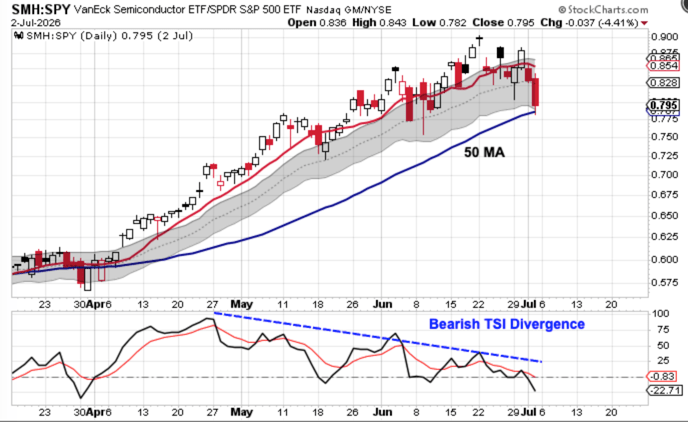
The SMH:SPY ratio has been in a daily uptrend, reflecting the strong relative performance of semiconductor stocks compared to the S&P 500 from April through June.
After peaking on June 22, the ratio formed a swing high and closed below the 10-day moving average on Wednesday before delivering additional weakness on Friday. Despite the pullback, support emerged at the 50-day moving average, preserving the daily uptrend.
What is clear is that semiconductor leadership is being tested, but it has not yet broken down. This signals that the recent weakness remains a normal pullback within the existing daily uptrend while the ratio continues to hold above the lower daily cycle band.
However, bearish follow-through that closes below both the 50-day moving average and the lower daily cycle band would end the daily uptrend and begin a daily downtrend. That move would also signal the intermediate cycle decline, indicating that semiconductor leadership is beginning to weaken relative to the broader market.
Until then, the current evidence continues to favor semiconductors as one of the market’s leadership groups.
Current Framework
Trend: Daily uptrend.
Cycle: Leadership testing support.
Next Trigger: A close below the 50-day moving average and the lower daily cycle band signals a daily downtrend and the intermediate cycle decline.

Leave a comment