
Pre-Summary
Outperformance is measured by producing better results than a benchmark. After nearly four years of underperformance, small caps are beginning to show improving relative strength versus the S&P 500.
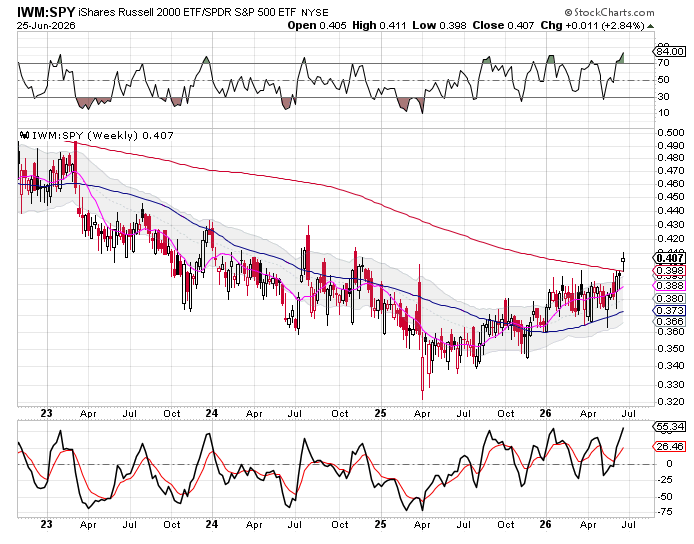
Outperformance is the act of producing better results than a benchmark. One of the simplest ways to measure an asset’s performance is to compare it to the S&P 500. The IWM:SPY ratio compares the performance of the Russell 2000 to the S&P 500 and provides a clear view of relative strength.
From a cycle perspective, the IWM:SPY ratio spent nearly four years in a downtrend before beginning to change in December 2025. The ratio closed above both the 10-week and 50-week moving averages in December, then closed above the upper weekly cycle band in January to establish a weekly uptrend.
This week, the ratio broke above the 200-week moving average, marking another important improvement in its technical structure. The ratio is currently stretched above the 10-week moving average and may need to consolidate, helping to allow the moving average time to catch up to price.
What is clear is that relative strength continues to improve. Breaking above the 200-week moving average indicates a continuation of the weekly uptrend and signals a weekly cycle band buy signal. However, some consolidation would not be unusual following such a strong advance.
Cycle Alignment
Bullish — The weekly uptrend remains intact, with improving relative strength supporting continued small-cap outperformance.

Leave a comment