
Stocks lost the 50 day MA on Thursday then delivered bearish follow through on Friday to signal the daily cycle decline.
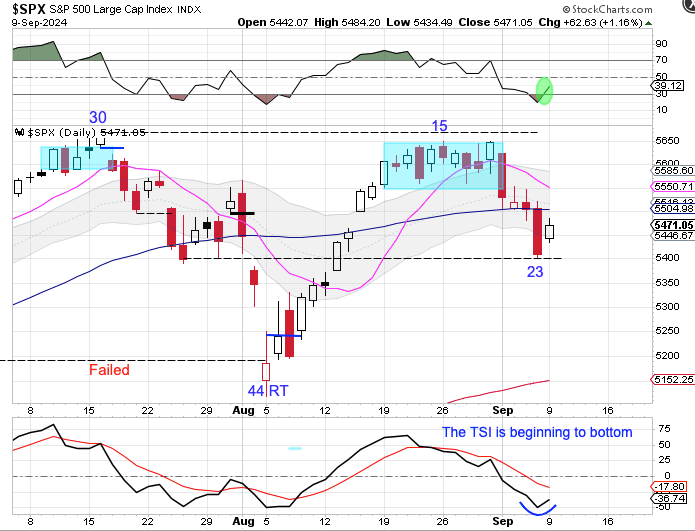
Stocks printed their lowest point on Friday, day 23, which is a bit stocks to expect a DCL to form. Stocks found support at the 5400 level on Friday and rallied on Monday. A close back above the 50 day MA would signal a new daily cycle. We will use a close above the 10 day MA to label day 23 as the DCL. However, stocks are still in a daily downtrend. A break below the 5400 support level will indicate a continuation of their daily downtrend and signal a cycle band sell signal.

Leave a comment