
Stocks formed a swing low on Monday off of support from the 50 day MA.
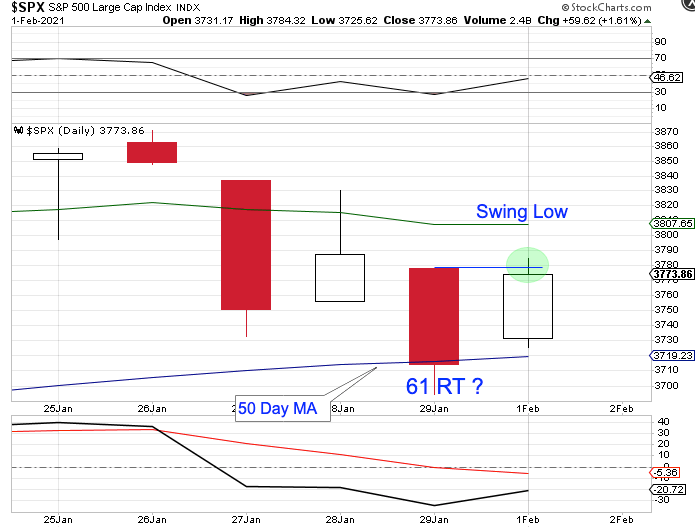
Stocks printed their lowest point on Friday, day 61. That places them late in their timing band for a daily cycle low. Therefore Monday’s swing low has good odds of marking the DCL.
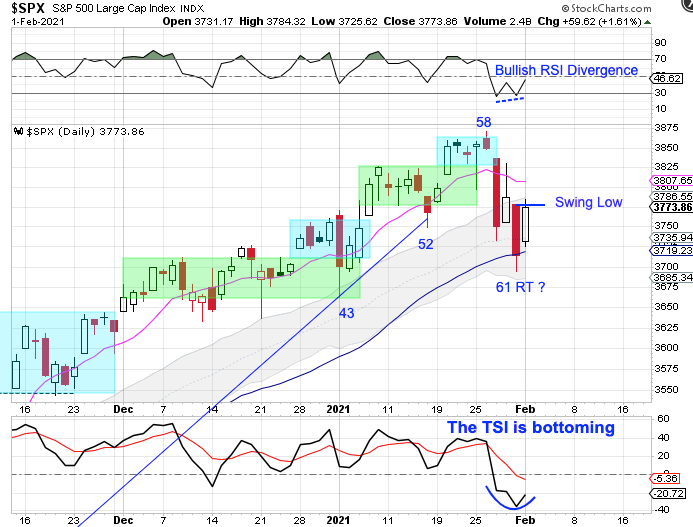
Notice the bullish RSI divergence. If this was the start of an intermediate cycle decline, then RSI would start to embed in oversold. The bullish RSI divergence signals a continuation of the intermediate cycle advance. That aligns with stocks being in a daily uptrend. The swing low formed above the lower daily cycle band to indicate that stocks will remain in their daily uptrend. If stocks deliver bullish follow through and closed above the 10 day MA that will trigger a cycle band buy signal.
And if stocks deliver bullish follow and close back above the 10 day MA then that will indicate that the breakout continues to advance.

Leave a comment