Stocks: The Big Picture

x

I believe that stocks printed their year cycle low. Therefore 1st intermediate cycle should form as a right translated weekly cycle.

spx-weekly

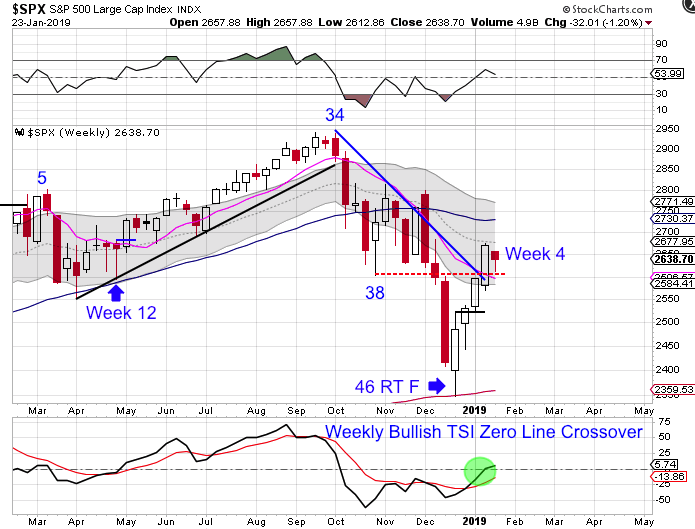
Looking back at all of the yearly cycle lows dating back to the 2009 Financial Crisis low, every intermediate cycle following a yearly cycle low formed as a right translated weekly cycle, peaking no earlier than week 10. Some went on to peak on week 27. So with stocks on only week 4, there is plenty of time for stocks to rally.

4 responses to “Stocks: The Big Picture”

  1. Me_XMan Avatar
    Me_XMan

    Have you looked at 2001? It’s doing the same?

    1. likesmoneystudies Avatar
      likesmoneystudies

      Yes, if you are referring to the Sept low.
      In 2001 stocks were in a bear market decline.
      September marked the YCL.
      But even then, stocks rallied for 15 weeks emerging from its YCL.

  2. Gregory Ewanizky Avatar
    Gregory Ewanizky

    I don’t mean to troll you but this intermediate bottom after 46 weeks is by far the longest in the last 10 years. What kind of conclusions can we draw from that? Thanks for your work

  3. likesmoneystudies Avatar
    likesmoneystudies

    The 2011 multi-year low did have a stretched weekly cycle – stetted to 28 weeks.
    This was obviously longer.
    My take away is that the Fed has improved its “handling” of the market and has begun to stretch cycles. Consider this, there have been 21 intermediate cycles since the 2009 financial crisis low. Since the 2009 low, there have only been 3 left translated weekly cycles. And two of those left translated weekly cycles resulted in multi-year lows (2011, 2016)

Leave a reply to Gregory Ewanizky Cancel reply

This site uses Akismet to reduce spam. Learn how your comment data is processed.