
Tuesday was day 33 for the daily equity cycle. That places stocks in their timing band to seek out a daily cycle low.

Stocks printed their daily cycle high last Thursday, day 31, which assures us of a right translated daily cycle formation. But stocks have since closed lower for 2 straight days, which eases the parameters for forming a daily swing high. A break below 2450.02 forms a swing high. Then a break below the daily cycle trend line will confirm that stocks are in a daily cycle decline.
Stocks continue to close above the upper daily cycle band indicating that they are in a daily uptrend. As long as stocks form a swing low above the lower daily cycle band, then stocks will remain in their daily uptrend. And under that scenario, the dip should be bought.
The transports have already confirmed their daily cycle decline.
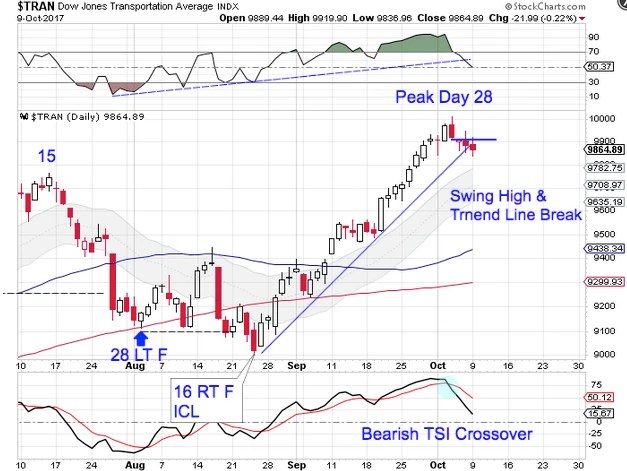
Tuesday was day 31 for the transports daily cycle. That places them in their timing band to seek out a daily cycle low. The transports have already formed a swing high and broke below the daily cycle trend line to confirm that they have entered their daily cycle decline. The transports have also been in a daily uptrend. They will remain so unless they close below the lower daily cycle band.

Leave a reply to Joerg Mueller Cancel reply