0

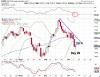
So today was day 29 for the daily equity cycle and stocks printed a reversal that pierced the lower Bollinger Band.

spx daily

A break above 1662.47 forms a swing low. Then we will need to see a break of the declining trend line to confirm a new daily cycle. While a day 29 low may be a tad early for a daily cycle low, it is not without precedent as you can see below.

10 12 6 13 daily

The first daily cycle emerging from the November 2012 intermediate cycle low did form as a 29 day daily cycle.

Getting back to the current daily cycle, if today stands as the daily cycle low then it forms as a right translated cycle. Our framework was expecting a left translated cycle that leads into an intermediate cycle decline.

Well equities may have thrown us a curve ball on this daily cycle. But we will need to keep our eye on the ball because it appears that the intermediate decline has already begun.

spx weekly

Stocks are currently on week 15 of the intermediate cycle. The decline this week has caused stocks to break below the intermediate cycle trend line. That signals an intermediate cycle decline. So if a new daily cycle begins tomorrow, it should lead into the intermediate cycle low.

Now here is something that I am keeping my eyes on.

DXY00 Commodity Futures Price Chart for U S D

The dollar printed a 32 left translated low last Thursday. Wednesday was day 4 of the new dollar cycle. The dollar backtest the yearly low and retreated. While it is unclear if this new daily cycle is also a new intermediate cycle, a swing high forming here would confirm that this daily cycle is part of the ongoing failed intermediate cycle.

I find it no coincidence that the dollar was rejected at the previous yearly low and the Miners printed a reversal.

GDX Sharp Charts Workbench Stock Charts com 20

Wednesday was day 17 for the daily Miner cycle. The Miners tagged the lower Bollinger Band and reversed higher into the close. A break above 24.16 forms a swing low. Then a break above the declining trend line will confirm a new daily cycle.

8 responses to “”

  1. pk34145 Avatar
    pk34145

    LM,
    Thanks for the report. The charts are not coming through today (and I normally never have a problem seeing your charts). Not sure if other readers are experiencing this problem.

    1. dennis500 Avatar
      dennis500

      I see them okay.

    2. likesmoneystudies Avatar
      likesmoneystudies

      pk34145

      Sometimes that happens to me. I found if I refresh my browser it works.
      However here are the imagebam images.

      imagebam.com imagebam.com imagebam.com imagebam.com imagebam.com

  2. 3kpd Avatar
    3kpd

    I see them OK too. Charts are clear and the message is clear. Look for dropping $US and rising S&P and Miners. Just to clarify, your phrasing is “break above 1662.47” and “break above 24.16”.
    Does that mean any intraday cross above, and hourly close above, or an acutal daily close above?

    1. likesmoneystudies Avatar
      likesmoneystudies

      Technically speaking a print of 1662.48 and a print of 24.17 respectively forms a swing low.
      That is why I like to see other confirmation like a break of the declining trend line or a bullish TSI crossover.

    2. likesmoneystudies Avatar
      likesmoneystudies

      Here is one more thing, dollar is looking pretty strong here. If it breaks through the resistance at 80.60 we just may have a new intermediate cycle rally unfolding. Hard to say right now but it this bounce out of the daily cycle low extends past 8 days then that increases the odds of this being a new intermediate cycle.

  3. vorfahrt Avatar

    Selling on strength today on UUP and also some on SPY. Looks like continued weakness for both after the current bounce concludes.

    1. likesmoneystudies Avatar
      likesmoneystudies

      That is a pretty big number for SOS on UUP.

Leave a reply to pk34145 Cancel reply

This site uses Akismet to reduce spam. Learn how your comment data is processed.