
Bonds cycle through its yearly and three year cycles like clock work.

The yearly bond cycle prints a yearly low every 10 – 13 months.
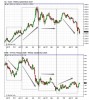
We see above that March was month 12 of the yearly cycle.
A monthly swing low and declining trend line break occurred off the March low confirming a new yearly cycle.

Bonds form a three year cycle low every 34 – 37 months.
March was month 34 for the three year bond cycle. We see that a swing low and declining trend line break occurred off the March low declaring a new three year cycle.
Now notice that May is in the process of printing a bearish engulfing candle. That is an ominous signal at month 2 of both the yearly and three year cycle.
Now let’s break this down on a weekly basis.

Week 9 saw bonds break below the intermediate cycle trend line and week 10 saw more follow through to the downside. Instead of a right translated weekly cycle emerging from the yearly cycle low bonds look to be printing a left translated weekly cycle that will fail.
In summary:
Bonds appeared to have printed its yearly and three year cycle low in March.
A bearish engulfing candle is forming on the monthly chart.
The Weekly Cycle sports a week 8 peak followed by a trend line break and follow through to the downside.
I suppose that I should keep an open mind that this is a stretched yearly cycle. I believe that is a low probability event.
It looks like the three year cycle has topped at month 2.
And if that is the case…
Then bonds are toast …


Leave a reply to Joe Cancel reply