
Summary
• Stocks were rejected at the 10 day moving average early in the week.
• Bearish follow-through pushed price below the day 37 low and the 200 day moving average.
• The break below the 200 day moving average extends the daily cycle decline.
• Day 41 places stocks in their timing band for a daily cycle low.
• A quick recovery back above the 200 day moving average will be critical.
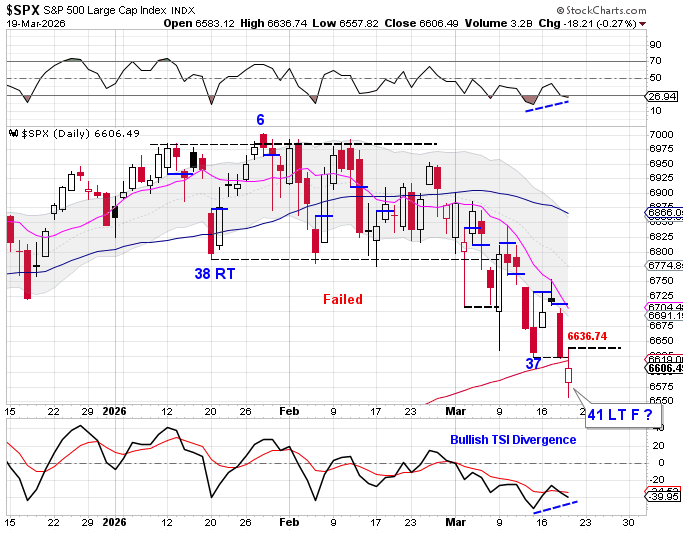
Stocks were rejected at the 10 day moving average on Tuesday and delivered bearish follow-through into Wednesday and Thursday. That weakness led to a break below the day 37 low on Wednesday, followed by a close below the 200 day moving average on Thursday — extending the daily cycle decline.
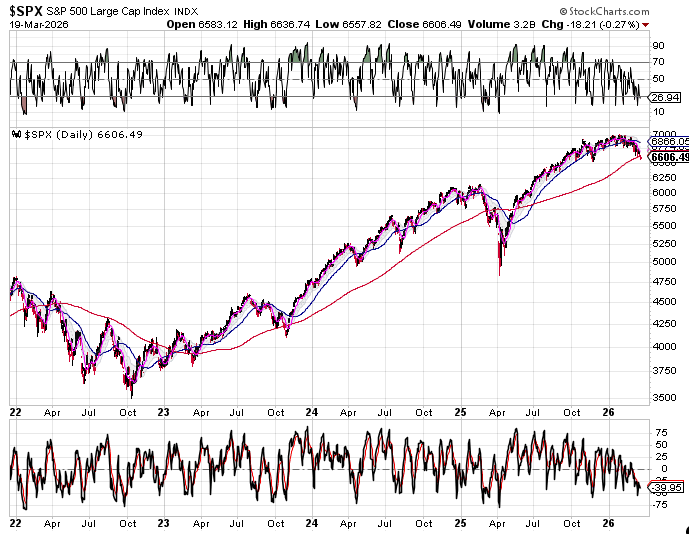
Looking at the longer-term chart, the last close below the 200 day moving average occurred in March of 2025, which led to a prolonged selloff. Prior to that, the October 2023 break below the 200 day moving average was short-lived.
This makes the current level critical. Stocks will need to recover the 200 day moving average quickly to avoid a larger drawdown similar to what we saw in early 2025. Thursday marked day 41 of the daily cycle, placing stocks in their timing band for a daily cycle low. A swing low with a close back above the 200 day moving average would signal that day 41 was the daily cycle low. A break above 6636.74 would form a swing low, and a close above the 10 day moving average would confirm it. Until then, stocks remain in a daily downtrend. Closing below the 200 day moving average indicates a continuation of that downtrend and signals a cycle band sell signal.
Cycle Alignment
Daily cycle decline is mature, but downside risk remains until key levels are reclaimed.

Leave a comment