
Summary
• Gold printed a large bearish candle on day 20.
• Gold formed a swing high and closed below the 10 day moving average on day 20, signaling the daily cycle decline.
• Instead of turning the 10 day MA lower, gold has been crawling along the 10 day MA, obscuring the daily cycle count.
• Gold closed back below the 10 day MA on Thursday.
• The rising 50 day MA may provide support for the next Daily Cycle Low (DCL).
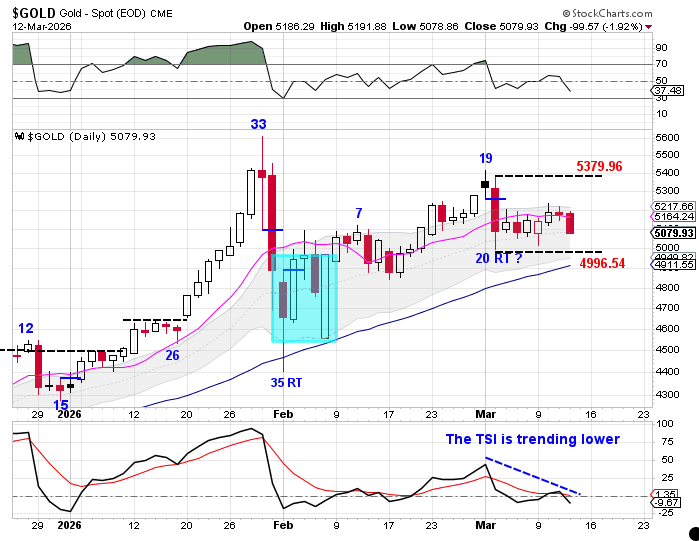
Gold printed a large bearish candle on day 20. Gold also formed a swing high and closed below the 10 day moving average on day 20, signaling the daily cycle decline. Gold should have gone on to turn the 10 day moving average lower in order to complete its daily cycle decline. However, that has not happened. Instead, gold has been crawling along the 10 day moving average, which has obscured our daily cycle count.
Gold closed back below the 10 day moving average on Thursday. Gold should now go on to break below the day 20 low of 4996.54 in order to complete the daily cycle decline. If that occurs, we will be watching the rising 50 day moving average as possible support for the Daily Cycle Low. Gold remains in a daily uptrend. Gold will remain in its daily uptrend unless it closes below the lower daily cycle band.
Takeaway
Gold has signaled a daily cycle decline but has been consolidating along the 10 day moving average. A break below the day 20 low would likely complete the cycle decline, with the rising 50 day moving average a potential area for the next cycle low.

Leave a comment