Summary
- Stocks formed a swing high and closed below both the 10 day moving average and the 50 day moving average on Thursday.
- Price continues to be rejected at the 7000 resistance level.
- Sideways action since late January has obscured the daily cycle count.
- The technical structure confirms a continuing daily downtrend and a cycle band sell signal.
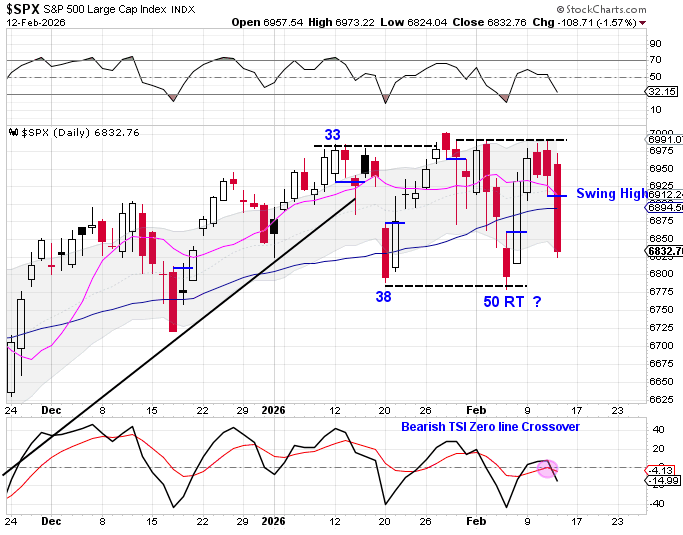
Stocks were rejected once again at the 7000 resistance level on Wednesday and formed a swing high on Thursday, closing below both the 10 day moving average and the 50 day moving average to signal the daily cycle decline.
Since late January, stocks have been trading sideways beneath the 7000 level. This prolonged consolidation has obscured the daily cycle count and created uncertainty around precise cycle timing.
There are two possible interpretations. Day 38 may have marked the daily cycle low, which would make Thursday day 17 of a failed daily cycle. Alternatively, Thursday could represent day 5 of an extremely left-translated daily cycle.
While the exact cycle labeling remains unclear, the directional message is not. Stocks are currently in a daily downtrend. Forming a swing high and closing below both key moving averages indicates a continuation of that downtrend and generates a cycle band sell signal.
Takeaway
Cycle timing is uncertain, but repeated rejection at 7000 and the loss of key moving averages confirm that the daily downtrend remains in control.

Leave a comment