Trade Tensions Rattle Market — Daily and Weekly Cycles Turn Down

Summary

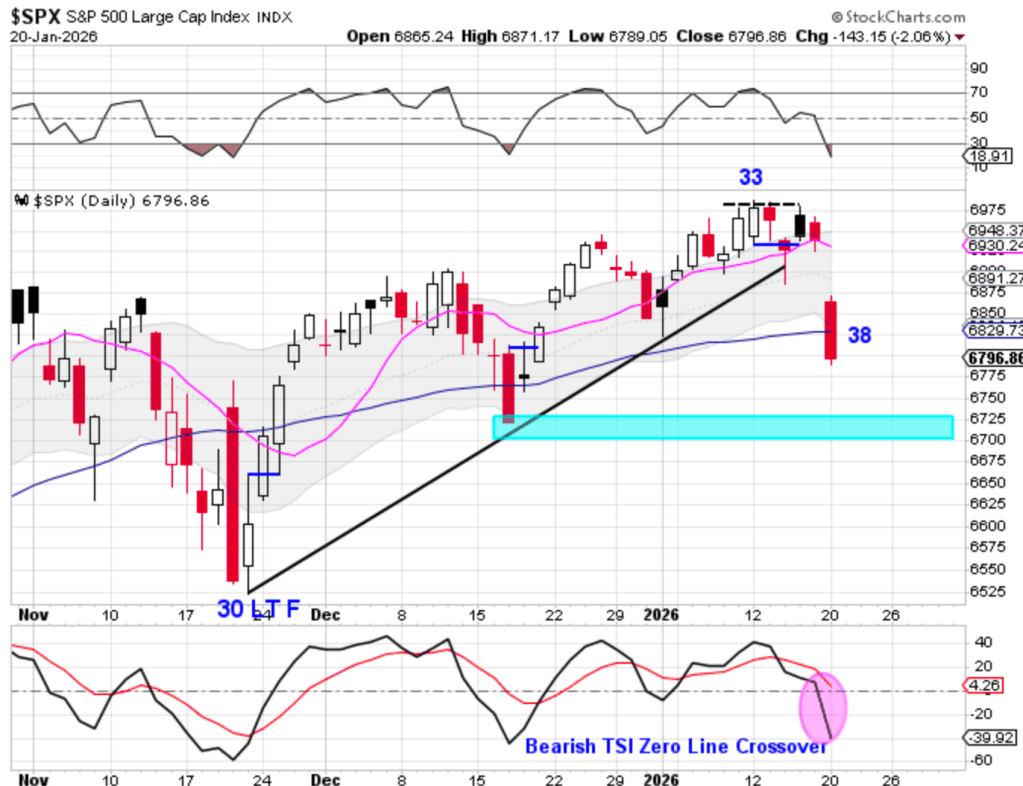
Stocks closed below the 10 day moving average on Friday and delivered bearish follow-through on Tuesday after President Trump escalated trade tensions with Europe over Greenland, including threats of higher tariffs on imports.

On Tuesday, stocks gapped lower and closed below the 50 day moving average, confirming the daily cycle decline. Tuesday marked day 38, placing stocks firmly inside their timing band for a DCL.

Stocks also closed below the lower daily cycle band. This action ends the daily uptrend and confirms the start of a daily downtrend. Importantly, a close below the lower daily cycle band also signals that the intermediate (weekly) cycle decline has begun.

Attention now turns to the 6700 level, which will be closely monitored as potential support for the daily cycle low to form.

9 responses to “Trade Tensions Rattle Market — Daily and Weekly Cycles Turn Down”

  1. ericlemeur2c508ebb6b Avatar
    ericlemeur2c508ebb6b

    so next cycle should be left translaled to bring in the ICL, with a LT DCH between 7 to 11 days after this DCL ?

    1. likesmoneystudies Avatar
      likesmoneystudies

      Yes, the odds favor that, barring any unforeseen black swan event or surprise tweet.

      1. ericlemeur2c508ebb6b Avatar
        ericlemeur2c508ebb6b

        Hi I was wondering if I could ask your thoughts

      2. likesmoneystudies Avatar
        likesmoneystudies

        Sure

      3. ericlemeur2c508ebb6b Avatar
        ericlemeur2c508ebb6b

        The YCL timing band appears to be November to January.

        – The 10 Month MA is at 3900.

        From a cycle theory viewpoint, this should mean that gold needs to correct to 3900 or below, sometime very soon to complete the Yearly cycle, yet this seems unlikely –  It seems like too big a drop given current price ?

      4. likesmoneystudies Avatar
        likesmoneystudies

        “The YCL timing band appears to be November to January.”
        – sometimes. Gold typically forms a YCL every 11 – 13 months
        So gold is deep in its timing band for a yearly cycle low.
        A monthly swing high and close below the 10 month MA will signal the yearly cycle decline.
        So with the 10 month MA currently sitting around 3900 – that does seem unlikely.
        Right now – gold is in a melt-up phase.
        The melt-up phase is stretching our cycle counts
        While there is no way to know just how far this can run, volatility is beginning to appear.
        One can either decide that they have gained enough and lock in profits or wait for a weekly swing high.
        While a weekly swing high does not guarantee a yearly cycle decline — Gold will not decline into a yearly cycle low until it forms a weekly swing high.

  2. Jack Sharples Avatar
    Jack Sharples

    There is about a 20 point spread between the TSI on semiconductors and the S&P 500. Semi’s are overbought and S&P is well into neutral territory. Any thoughts on overbought semiconductors.

    1. likesmoneystudies Avatar
      likesmoneystudies

      Hi Jack,
      Needless to say, but the semi’s have been leading the market and look to retake their leadership. When an asset is in a daily uptrend, it can remain oversold on the RSI for ongoing stretches. This looks like a buy the dip scenario.

      1. Jack Sharples Avatar
        Jack Sharples

        Thank you for getting back to me. I sold the semi’s just prior to 70 % RSI, that’s one of my trading rules. Based on your cycles analysis I think I will sit on the sidelines until the yearly cycle low because there’s too much downside for the semi’s, or I may decide to trade the S&P 500 instead if they get down to 30% on the 14 day RSI. Again, thanks for all you do!

Leave a comment

This site uses Akismet to reduce spam. Learn how your comment data is processed.