
Stocks are moving deeper into territory where multiple cycle degrees start to overlap. From a big-picture perspective, both the intermediate cycle and the yearly cycle are approaching timing windows that historically matter.
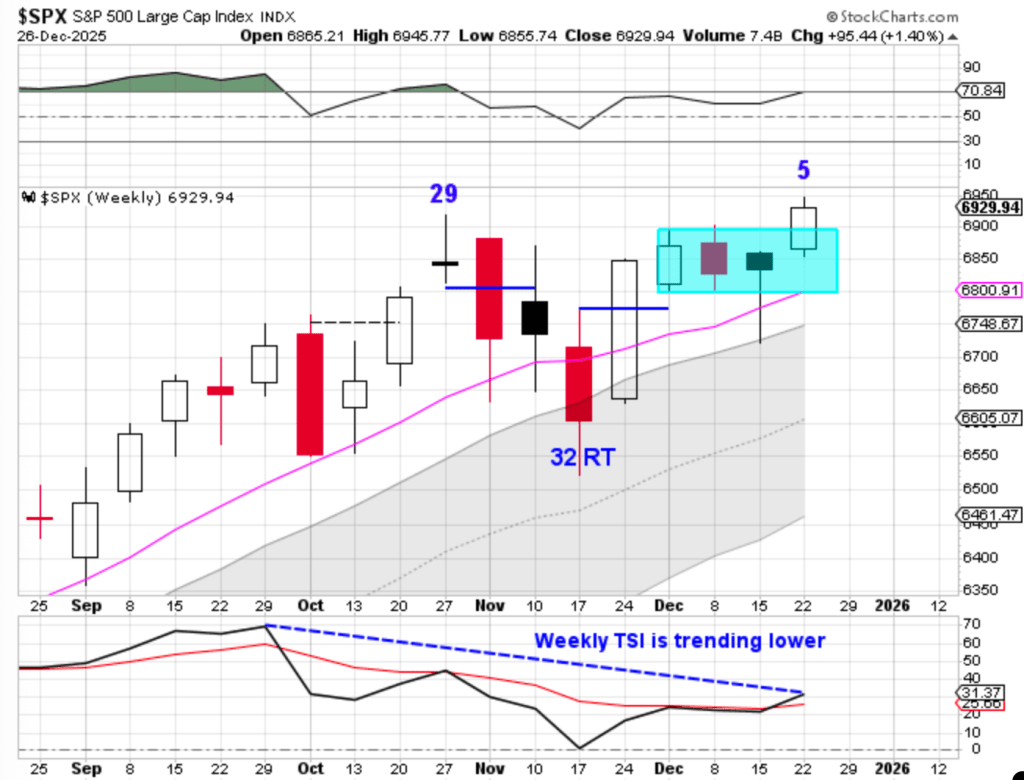
With stocks completing week 5 of the second intermediate cycle of the year, the focus shifts to how this cycle develops relative to the broader yearly structure. When longer-term cycles begin to compress, the behavior of the upcoming daily and weekly cycles becomes especially important — particularly whether they right translate or begin to fail.
Historically, stretched cycles are often followed by shorter ones, and left-translated failures at the daily or weekly level have frequently preceded larger cycle lows. That dynamic is something worth paying attention to as we move into the first half of next year.
I take a deeper look at how these timing bands are lining up — and what that could mean for 2026 — in the latest report: Intermediate and Yearly Timing Bands Align — 2026 Cyclical Expectations.
This week I am offering a special 6 week trial subscription, along with the Special Report Report – Intermediate and Yearly Timing Bands Align — 2026 Cyclical Expectations, for $15. Your 6 week trial subscription will give you full access to the premium site which includes:
1) The Weekend Report, which is posted usually Saturday mornings. It discusses Dollar, Stocks, Gold, Miners, Oil, & Bonds in terms of daily, weekly and yearly cycles – Which includes the Likesmoney Cycle Tracker.
2) The Mid-Week Update. Posted on Wednesday’s is a review of the daily charts for the above mentioned asset classes.
3) The Weekend Updates take a look of the daily & weekly charts of BTC, DAX, Copper, NATGAS & XLE.
4) Weekly Update of the Bullish Percentile Bingo
5) Frequent updates of my proprietary Buy/Sell Indicators for GDX & FAS & FBTC, and XLE.
The goal of the Weekend Report is to develop an on-going framework of expectations using cycle analysis. Click here for the report and trial subscription.

Leave a comment