
Summary
- This demonstrates how moving averages across different timeframes shape Cycle Analysis.
- The dollar briefly broke above the 200 day moving average on day 5 but failed to hold the breakout.
- Price quickly closed back below the 200 day MA, negating the attempted bullish trend shift.
- Monthly chart reveals the real reason: the dollar remains capped by the declining 10 month moving average.
- September (month 12) likely marked the Yearly Cycle Low, but the monthly downtrend structure is still intact.
Today offers a clear demonstration of how moving averages across different timeframes can govern price action — and why they play such a central role in Cycle Analysis.
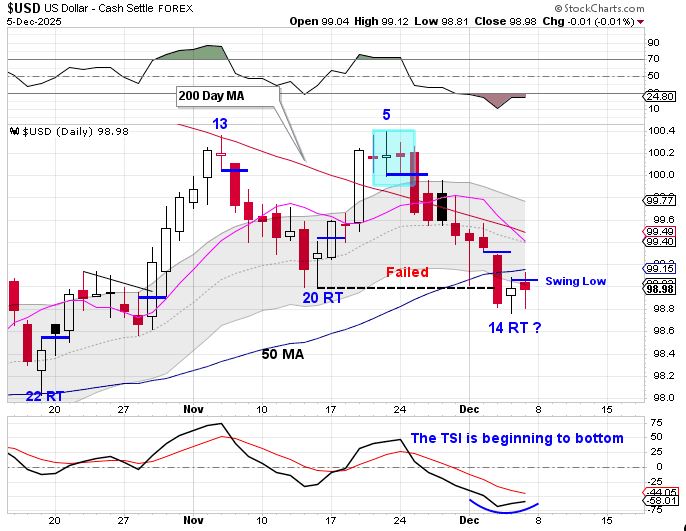
Daily Chart: Breakout Attempt Fizzles
On the daily chart, the dollar broke above the 200 day moving average on day 5, giving the appearance that a trend change might be underway.
However, the dollar was unable to sustain the breakout. Price quickly reversed and closed back below the 200 day MA, signaling that the momentum behind the move was insufficient — or that something larger was still in control.
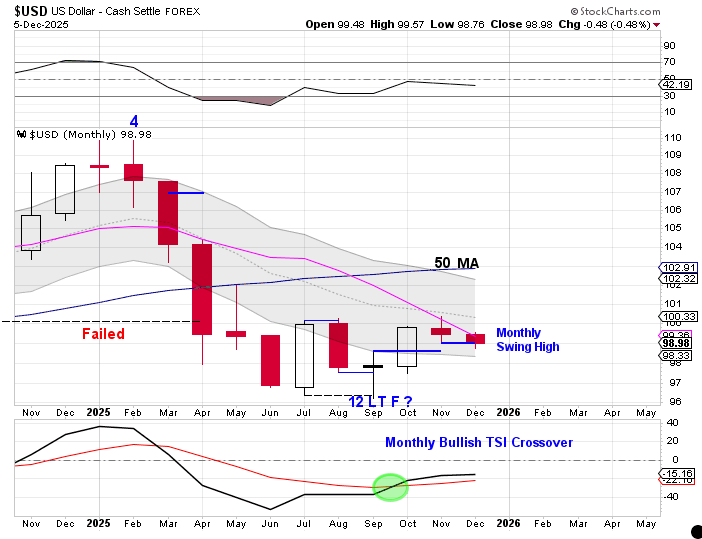
Monthly Chart: The Real Source of Resistance
That “something larger” becomes obvious on the monthly chart.
- The dollar printed its lowest point in September, which was month 12, placing it within the timing band for a Yearly Cycle Low (YCL).
- It then formed a monthly swing low, an early constructive sign.
- But the dollar remains contained by the declining 10 month moving average, which continues to act as structural resistance in the ongoing downtrend.
This declining 10 month MA on the monthly timeframe essentially “choked off” the attempted breakout seen on the daily chart. Until price can close above this level, the larger trend remains dominant.
Why This Matters
This is a textbook example of how multi-timeframe alignment — or lack of alignment — dictates whether a breakout has staying power.
Moving averages are one of the tools in the Cycle Analysis framework for identifying these structural forces.

Leave a comment