
Stocks bottomed on November 21st.
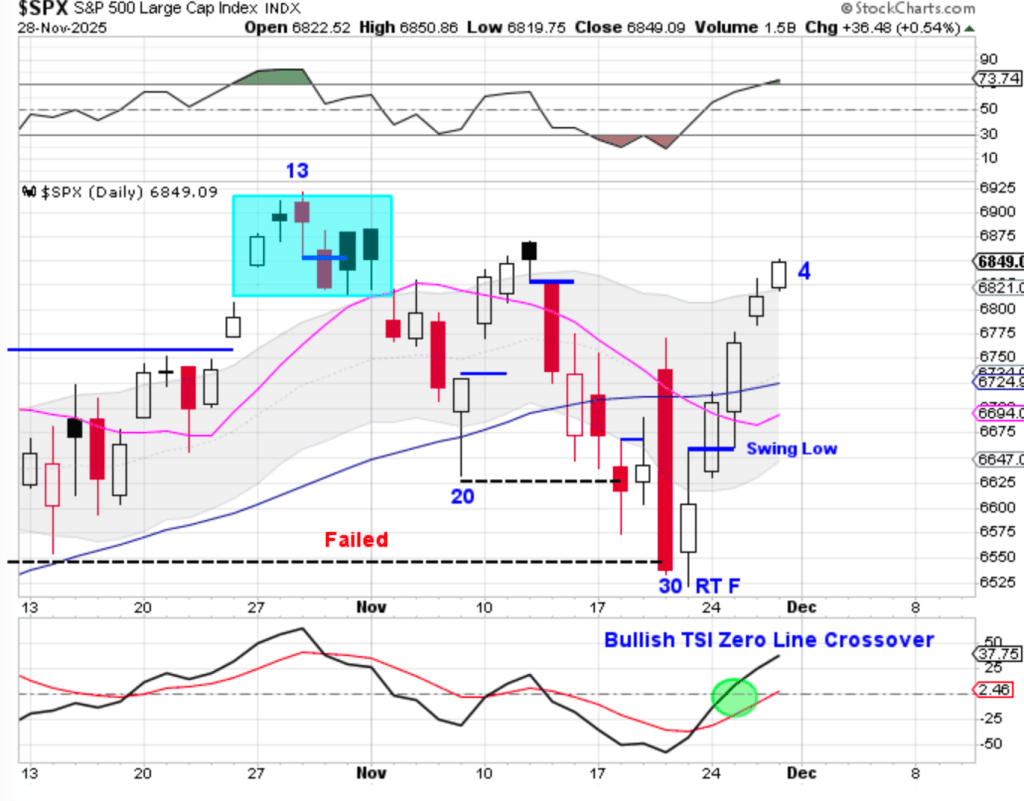
That made Friday day 4 for the new daily cycle for the broader market. Nvidia, however, is still seeking out its own daily cycle low.

Nvidia broke below its previous DCL on November 21st and failed to form a swing low at that time. The decline continued into Tuesday, where NVDA printed a lower low on day 24 — a bit early for the typical timing of its DCL. Nvidia did manage to form a swing low on Wednesday, but it was immediately rejected by the declining 10 day moving average and then formed a swing high on Friday. For us to label day 24 as the DCL, Nvidia will need to form a new swing low and close above the 10 day MA.

The weekly chart adds an important layer. Nvidia just printed its lowest point following the week 29 high. That makes last week — week 33, placing Nvidia very deep within its timing band for an intermediate cycle low. NVDA remains in a weekly uptrend. A weekly swing low and a close above the 10 week MA would signal a continuation of the weekly uptrend and trigger a weekly cycle band buy signal. A break above 183.50 will form the weekly swing low.
Summary:
Once Nvidia completes its daily cycle low, the odds strongly favor that it will also be forming its intermediate cycle low. And the first daily cycle of a new intermediate cycle typically right translates — meaning a peak beyond day 20 is the expectation. That’s often where the strongest upside momentum emerges.
Cyber Monday Offer.
Get a 1 month trial subscription along with a Cycle Analysis of a stock of your choice for $15.
Also included is access to the Special Report: Intermediate Expectations
In the Special Report I discuss:
The current status for the intermediate stock market cycle.
and what the historical timing suggests for the next major rally phase.
Here is what is included a Weekend Report Subscription
1) The Weekend Report, which is posted usually Saturday mornings. It discusses Dollar, Stocks, Gold, Miners, Oil, & Bonds in terms of daily, weekly and yearly cycles – and it includes the Likesmoney Combination Cycle Tracker & Trend Tracker.
2) The Mid-Week Update. Posted on Wednesdays is a review of the daily charts for the above mentioned asset classes.
3) The Weekend Updates, posted on Sundays, looks at the daily & weekly charts of the BTC, Dax, Copper, Natgas & XLE.
4) Weekly Update of the Bullish Percentile Bingo.
5) Frequent updates of my proprietary Buy/Sell Indicator.
The goal of the Weekend Report is to develop an on-going framework of expectations using cycle analysis. Click here for the Cycle Analysis of a stock of your choice and Trial Subscription Cyber Monday offer.

Leave a comment