
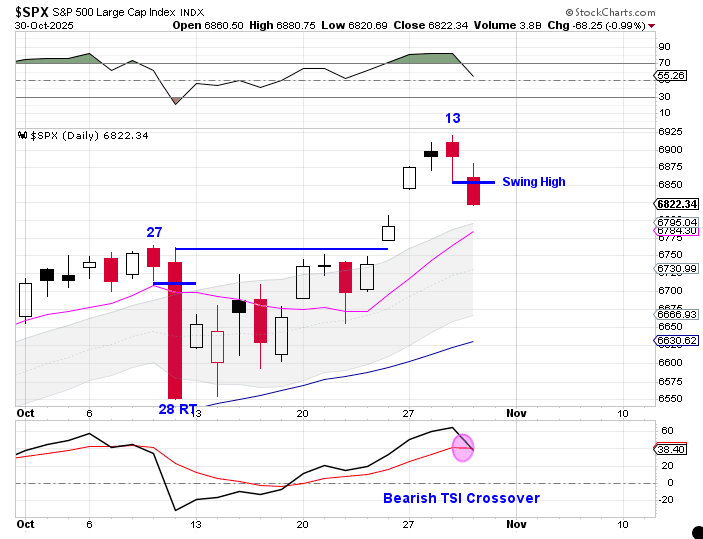
On Wednesday, day 13, stocks became stretched above the 10 day moving average. This type of extension often leads to short-term consolidation, helping the 10 day MA catch up to price. However, stocks formed a swing high on Thursday. If stocks deliver bearish follow through and close below the 10 day MA, that would set up a potential left-translated daily cycle formation — a structure that can lead into a larger intermediate cycle decline.
Stocks remain in a daily uptrend for now, but the next few sessions could determine whether this is a brief pause within the trend or the start of a more meaningful shift in market momentum.
In my Special Report, The Clock Is Ticking, I take a deeper look at:
- What typically happens when intermediate cycles stretch beyond 28 weeks
- How the current structure compares to prior topping patterns
- The key levels that would confirm the next major trend shift
- Potential Catalyst
This week I am offering a special 6 week trial subscription, along with the Special Report: Clock Is Ticking for $15. Your 6 week trial subscription you will give you full access to the premium site which includes:
1) The Weekend Report, which is posted usually Saturday mornings. It discusses Dollar, Stocks, Gold, Miners, Oil, & Bonds in terms of daily, weekly and yearly cycles – Which includes the Likesmoney Cycle Tracker.
2) The Mid-Week Update. Posted on Wednesday’s is a review of the daily charts for the above mentioned asset classes.
3) The Weekend Updates take a look of the daily & weekly charts of BTC, DAX, Copper, NATGAS & XLE.
4) Weekly Update of the Bullish Percentile Bingo
5) Frequent updates of my proprietary Buy/Sell Indicators for GDX, FAS, FBTC, and XLE.
The goal of the Weekend Report is to develop an on-going framework of expectations using cycle analysis. Click here for the report and trial subscription.

Leave a comment