
Stocks dropped 2.71% on October 10 to print their lowest point on day 28, placing them squarely within the timing band for a DCL. After consolidating that drop for nine sessions, stocks finally formed a swing low on Friday — signaling day 28 as the DCL.
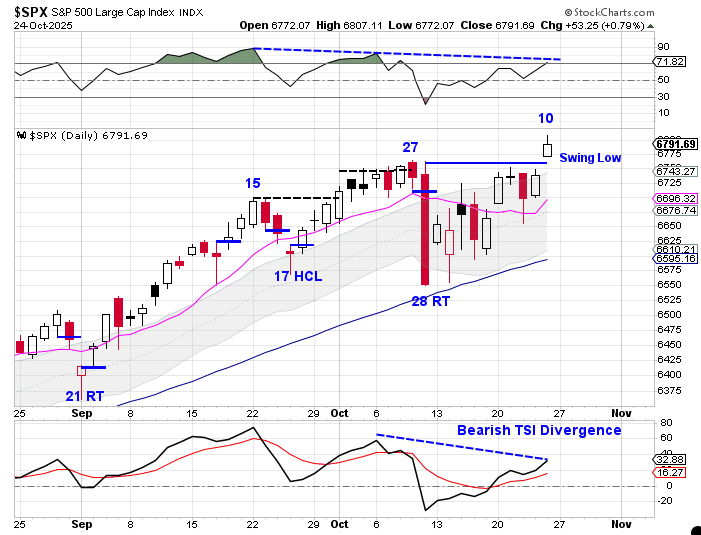
With that, the daily uptrend remains intact. A swing low forming above the upper daily cycle band confirms a cycle band buy signal, and for now, momentum favors a continued advance.
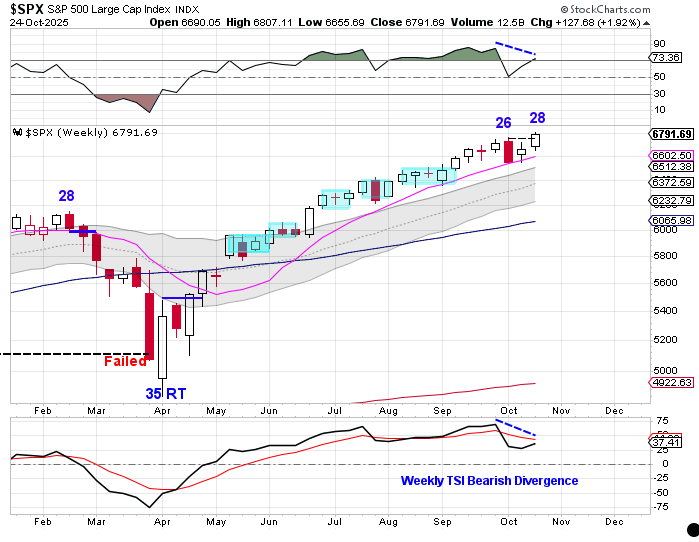
However, while the daily cycle may be turning up, the intermediate cycle is aging. At week 28, stocks are already well past the typical duration of most intermediate cycles. This raises the question: how much fuel is left in this move?
There may also be an outside factor setting up in the background — one that could act as a catalyst for the next major move.
In this weekend’s Special Report, Clock Is Ticking, I take a deeper look at:
- What typically happens when intermediate cycles stretch beyond 28 weeks
- How the current structure compares to prior topping patterns
- The key levels that would confirm the next major trend shift
- Potential Catalyst
This week I am offering a special 6 week trial subscription, along with the Special Report: Clock Is Ticking for $15. Your 6 week trial subscription you will give you full access to the premium site which includes:
1) The Weekend Report, which is posted usually Saturday mornings. It discusses Dollar, Stocks, Gold, Miners, Oil, & Bonds in terms of daily, weekly and yearly cycles – Which includes the Likesmoney Cycle Tracker.
2) The Mid-Week Update. Posted on Wednesday’s is a review of the daily charts for the above mentioned asset classes.
3) The Weekend Updates take a look of the daily & weekly charts of BTC, DAX, Copper, NATGAS & XLE.
4) Weekly Update of the Bullish Percentile Bingo
5) Frequent updates of my proprietary Buy/Sell Indicators for GDX, FAS, FBTC, and XLE.
The goal of the Weekend Report is to develop an on-going framework of expectations using cycle analysis. Click here for the report and trial subscription.

Leave a comment