
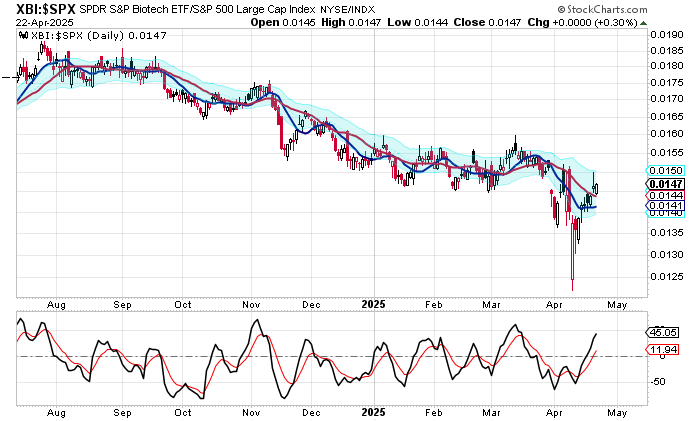
Outperformance is the act of producing better results. One way to measure the performance of an asset is to compare it to the S & P 500. The above chart compares XBI, the SPDR Biotech ETF to the S & P 500.
Most asset classes tanked back on April 9th, including XBI. In fact, XBI has been in a downtrend for the past 8 months when compared to the S&P 500. But that has begun to change.
Here are the top 10 holdings of XBI:
ALNY, INSM, NBIX, UTHR, AMGN
ABBV, GILD, NTRA, VRTX, BIIB
And below are some of the more interesting charts.


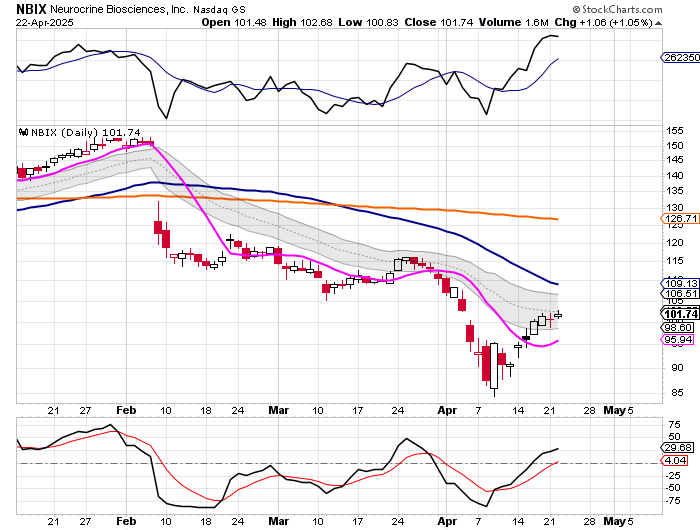
All of the above stocks have already closed back above their 10 day MA.

And VRTX closed back above its 10 day MA, its 50 day MA, and Its 200 day MA.

Leave a comment