
NextEra Energy is the world’s largest producer of wind and solar energy, making it a key player in the growing renewable energy sector. The company has consistently delivered earnings and revenue growth, including a 9% increase in earnings per share (EPS) in Q3 2024 and a 5.5% increase in revenue. NextEra Energy has a strong growth outlook through 2027, projecting steady increases in adjusted EPS and dividends. The company offers attractive dividends with a history of consistent increases, appealing to income-focused investors. High-profile deals like the 860-megawatt contract with Alphabet’s Google position the company to benefit from increasing energy demands from data centers and cloud providers. The company’s focus on clean energy and technological advancements makes it a frontrunner in the global transition to renewable power. As a dominant player in its sector, NextEra enjoys a competitive advantage, strong cash flows, and robust infrastructure.
Let’s begin our analysis with a look at the yearly cycle.

Since 2020, NEE formed a YCL every 11.4 months. January is month 15, placing NEE late in its timing band for its YCL. NEE is in the process of forming a bullish monthly reversal that is breaking above the 50 month MA. NEE is currently in a monthly uptrend. If Nee forms a monthly swing low and a closes above the 10 month MA that will indicate a continuation of its monthly uptrend and signal a monthly cycle band buy signal — which will have us us label month 15 as the YCL.
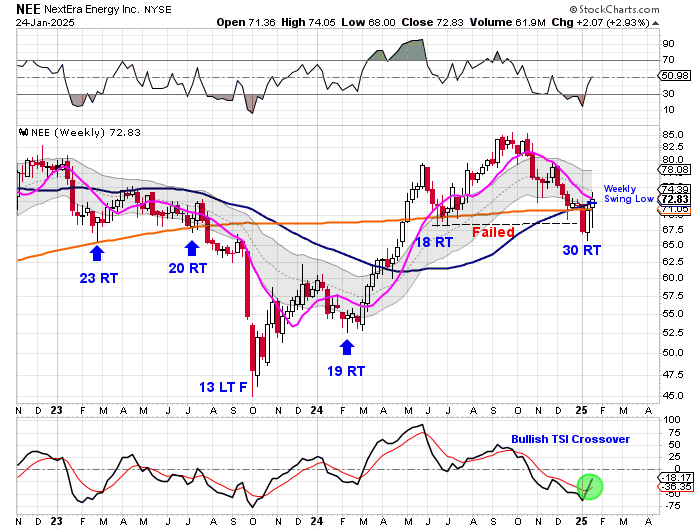
NEE has been averaging an intermediate cycle low every 20.5 weeks. NEE printed its lowest point the previous week. That was week 30, placing NEE deep in its timing band for an ICL. NEE formed a weekly swing low and closed above the both the 200 week MA and the 50 week MA to signal the new intermediate cycle. We will use a close above the 10 week MA to label week 30 as the ICL.

NEE has been in prolong sell off since early October. NEE printed its lowest point on Jan 13th. NEE formed a swing low and closed above the 10 day MA the previous week. NEE delivered bullish follow through on Friday so we will label Jan 13th as the DCL. NEE also closed above the upper daily cycle band on Friday. Closing above the upper daily cycle band ends its daily downtrend and begins a new daily uptrend. Closing above the upper daily cycle band also signals that the ICL has been set.
Summary:
- NEE has recently confirmed its new daily cycle.
- Closing above both the 50 week MA and 200 week MA signals that the ICL has been set.
- With NEE being early in both its daily and intermediate cycle shifts the odds that December hosted the yearly cycle low.
Cycles provides a framework for viewing the market. These cycles have a typical timing band, measured in days, weeks, and months for which it rallies and then declines into a cycle low. The interaction of the daily cycles with the weekly cycles helps to provide a directional tendency from which to base trades, in order to capitalize on higher probability set-ups. Click here for a Cycle Analysis for a Stock of your choice along with a 1 month trial subscription for $25.
Your trial subscription you will give you full access to the premium site which includes:
1) The Weekend Report, which is posted usually Saturday mornings. It discusses Dollar, Stocks, Gold, Miners, Oil, & Bonds in terms of daily, weekly and yearly cycles – Which includes the Likesmoney Cycle Tracker.
2) The Mid-Week Update. Posted on Wednesday’s is a review of the daily charts for the above mentioned asset classes.
3) The Weekend Updates take a look of the daily & weekly charts of BTC, DAX, Copper, NATGAS & XLE.
4) Weekly Update of the Bullish Percentile Bingo
5) Frequent updates of my proprietary Buy/Sell Indicators for GDX & FAS & FBTC.
The goal of the Weekend Report is to develop a dynamic framework of expectations using cycle analysis. Click here for a Cycle Analysis for a Stock of your choice along with a 1 month trial subscription.

Leave a comment