
Stocks formed a swing low on Tuesday
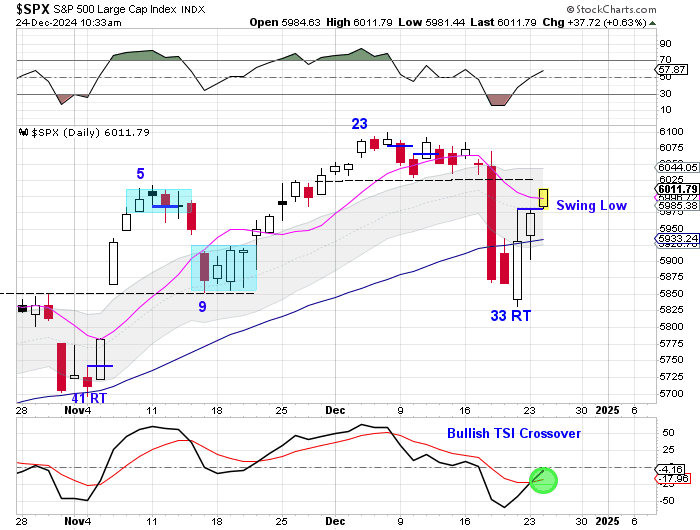
Stocks printed its lowest point on day 33, placing it its timing band for a DCL. Stocks are in the process of breaking above the 10 day MA. A close above the 10 day MA will have us label day 33 as the DCL.

And if day 33 was the DCL, that shifts the odds towards week 19 being the intermediate cycle low. And if week 19 is the ICL – that essentially kicks the can down the road — which I discuss in my Special Report.
In my special report – The Yearly Cycle Decline, we will look at historical data for previous yearly cycle declines. Then I will discuss the elements of the yearly cycle decline and then relate that to where stock are in their current yearly cycle. And, as bonus, I will also discuss the 4 year cycle low.
This week I am offering a special 6 week trial subscription along with the Special Report – The Yearly Cycle Decline – for $15. Your 6 week trial subscription you will give you full access to the premium site which includes:
1) The Weekend Report, which is posted usually Saturday mornings. It discusses Dollar, Stocks, Gold, Miners, Oil, & Bonds in terms of daily, weekly and yearly cycles – Which includes the Likesmoney Cycle Tracker.
2) The Mid-Week Update. Posted on Wednesday’s is a review of the daily charts for the above mentioned asset classes.
3) The Weekend Updates take a look of the daily & weekly charts of BTC, DAX, Copper, NATGAS & XLE.
4) Weekly Update of the Bullish Percentile Bingo
5) Frequent updates of my proprietary Buy/Sell Indicators for GDX & FAS & FBTC.
The goal of the Weekend Report is to develop a dynamic framework of expectations using cycle analysis. Click here for the special report and trial subscription.

Leave a comment