
Stocks printed their lowest point on day 44, placing them deep in its timing band for a DCL.
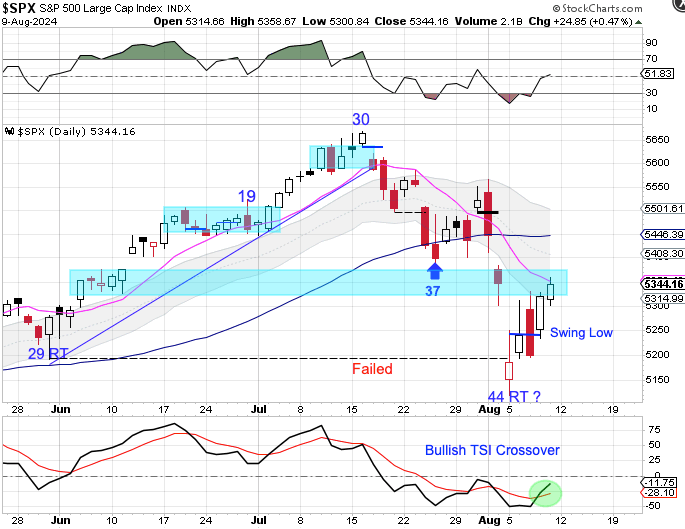
The decline into the day 44 low has caused the 10 day MA to decline sharply. Stocks are running into resistance at a previous consolidation zone along with the declining 10 day MA. A close above the 10 day MA will signal day 44 as the DCL. Stocks are currently in a daily downtrend. They will remain in their daily downtrend unless they close back above the upper daily cycle band.
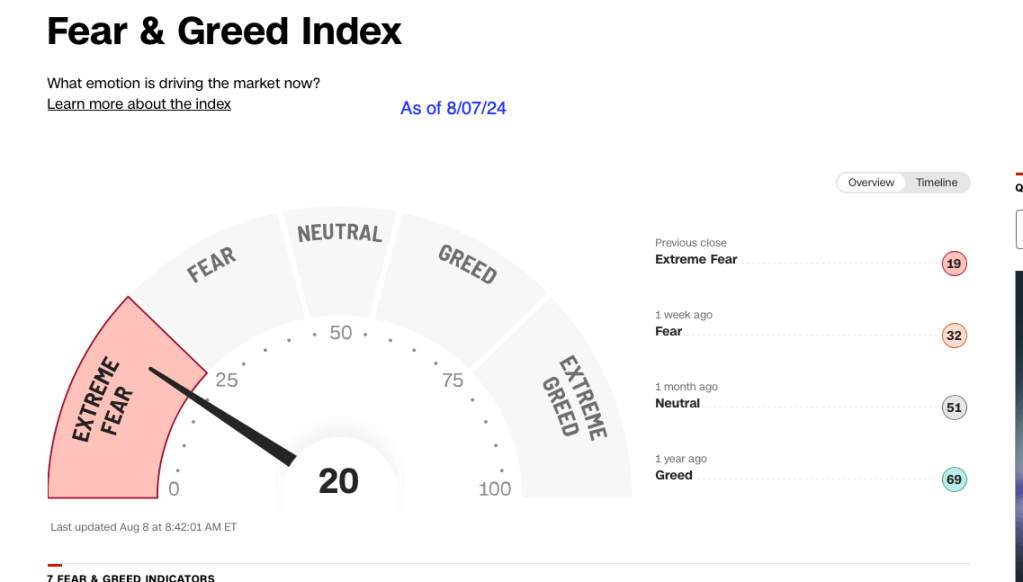
There is a lot of volatility in the market. Below is CNN’s the Fear & Greed Index indicating extreme fear.
In the Weekend Report I breakdown both the Bearish and Bullish scenarios for stocks.

Leave a comment