
Let’s start off with a look at the 2 hour chart.

Bitcoin was making a series of lower highs and lower lows — until 7/05/24. That changed and Bitcoin began making a series of higher lows and higher highs, breaking out to a new July high on Monday.
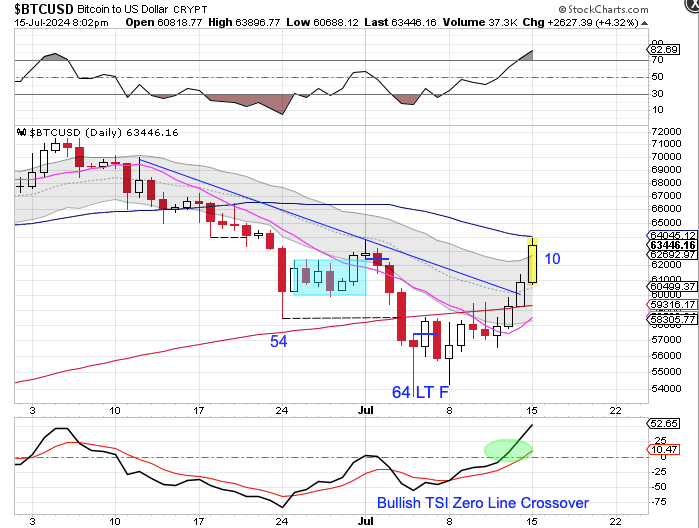
Moving on to the daily chart we see that Bitcoin printed its lowest point on July 5th — which was day 64, placing it very deep in its timing band for a DCL. Bitcoin closed above the 10 day MA on Friday. Bitcoin delivered bullish follow through closing above the 200 day MA on Saturday and higher again on Sunday so we will label day 64 as the DCL. Bitcoin is in currently running into resistance at the 50 day MA. BTC had been in a in a daily downtrend. But a close above the upper daily cycle band will end its daily downtrend and begin a new daily uptrend.

Leave a comment