
On Monday we looked at the big picture for stocks and the dollar. Tonight we will update those charts. Below was the weekly chart for stocks that was posted on the 24th.
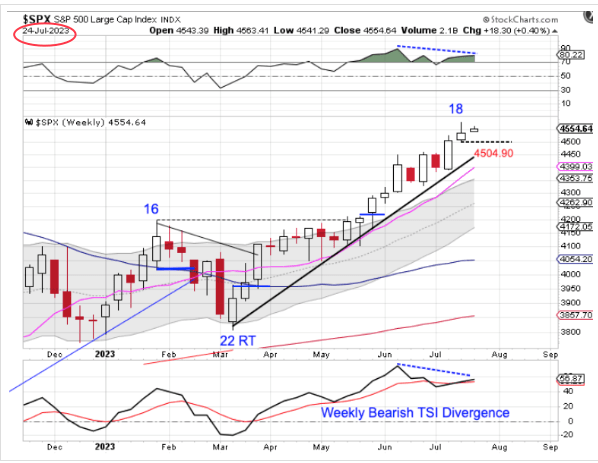
We noted that at 19 weeks stocks are in their timing band for an intermediate degree correction.
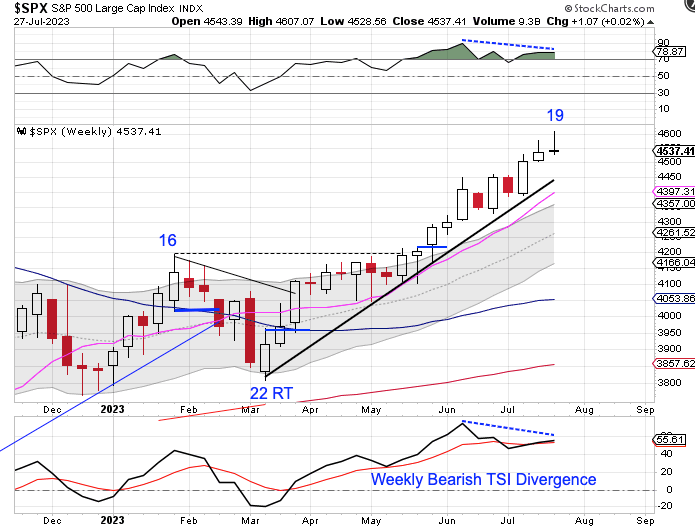
The same chart updated for Thursday shows that bearish divergences continue to develop on the weekly chart. We can also see that stocks are in the process of forming a weekly bearish reversal. A bearish weekly reversal will ease the parameters for forming a weekly swing high.
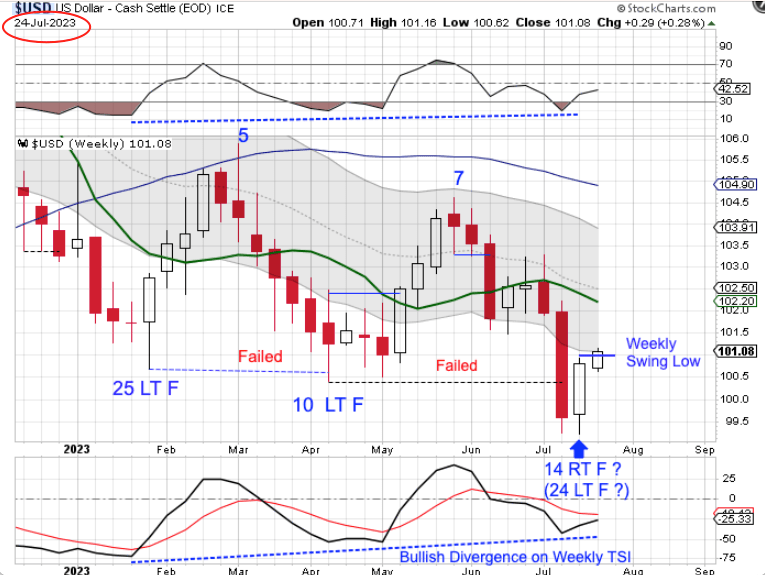
On Monday we noted that the dollar had already formed a weekly swing low. We also discussed how the dollar appears to be acting as if week 14 was week 24, which would place it in its timing band for an intermediate cycle low.
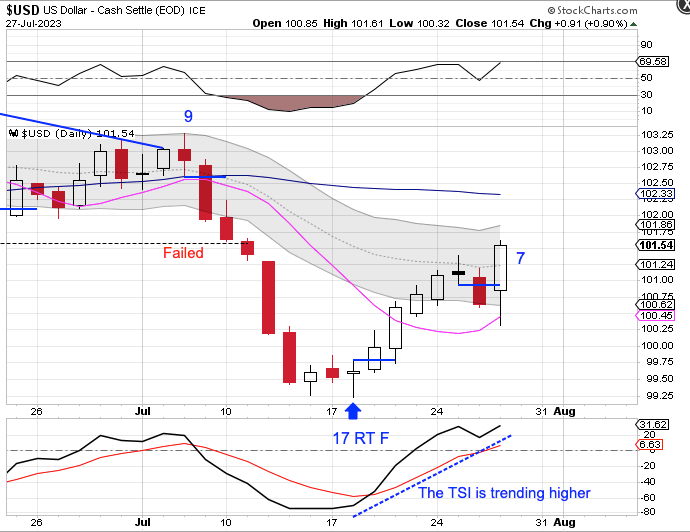
Switching over to Thursday’s daily chart shows that the dollar got a bit stretched above the 10 day MA on Tuesday. On Thursday the dollar formed a huge bullish reversal off support from the 10 day MA. This is a bullish surprise. If the dollar delivers any bullish follow through and closes above the upper daily cycle band, that would end the daily downtrend and begin a new daily uptrend. Closing above the upper daily cycle band would also signal that the intermediate cycle low has been set. And a dollar rallying into a new intermediate cycle would certainly put pressure on the stock market that is in its timing band for an intermediate cycle decline.

Leave a comment