
Stocks delivered bearish follow through by forming a swing high on Tuesday then closing lower again on Wednesday. However, they did not deliver bearish follow through on Thursday.
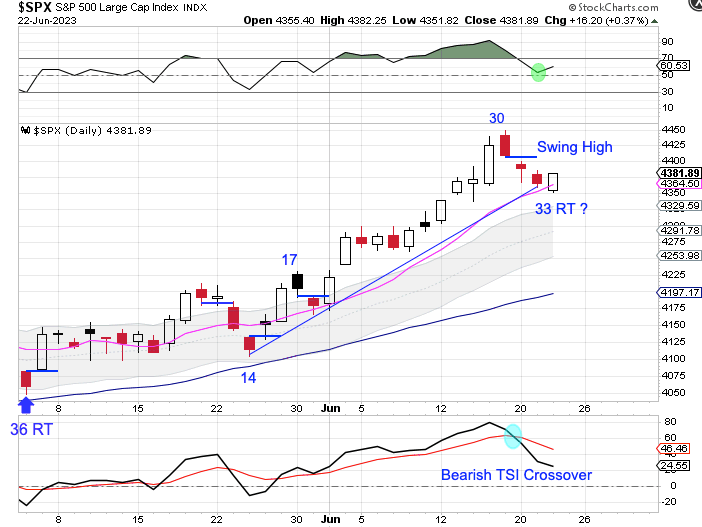
Thursday was day 33 for the daily equity cycle, placing stocks in their timing band for a DCL. While stocks breached both the daily cycle trend line and the 10 day MA, they ended closing higher for the day. And RSI 05 took a bullish turn. This makes me wonder if this is all of the decline that we will get? With stocks being in a daily uptrend, a swing low above the upper daily cycle band will indicate a continuation of the daily uptrend and signal a cycle band buy signal.
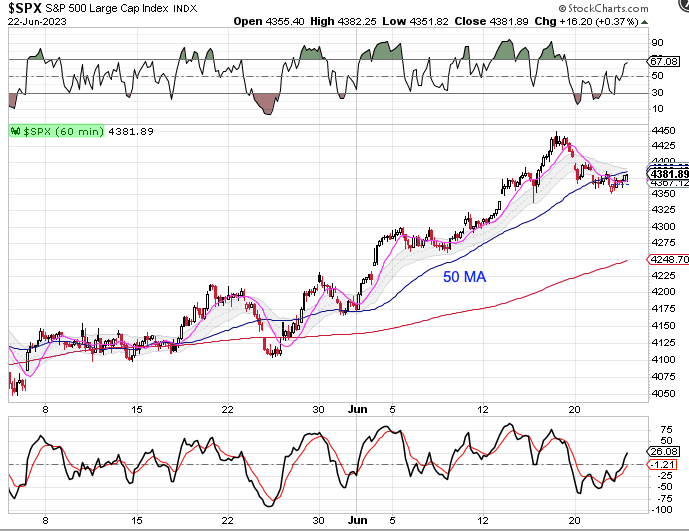
So I decided to look at the 60 minute chart and we can see that stocks closed below the 50 day MA, like they did back in May. But once they recovered the 50 MA on the 60 min chart — it was off to the races.
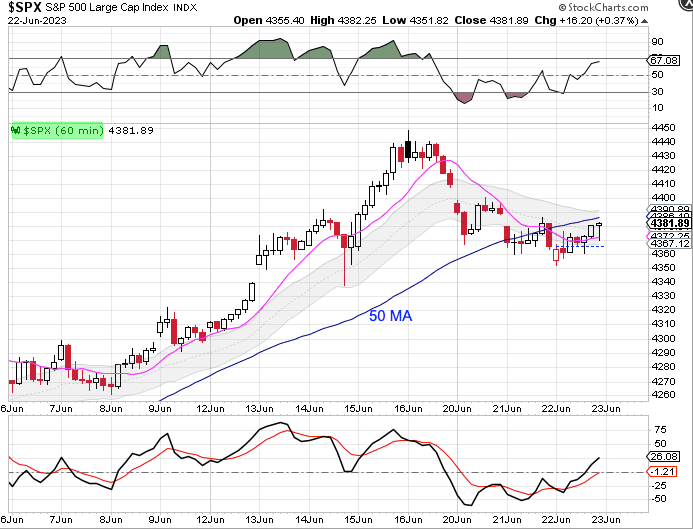
A closer look at the 60 minute chart shows us that stocks recovered the 10 MA but they are still below the 50 MA. So if stocks form a swing low on the daily chart and close above the 50 MA on the 60 min chart then we will label day 33 as the DCL.

Leave a comment