
The dollar rallied on Thursday, but is still contained by the declining 10 day MA.
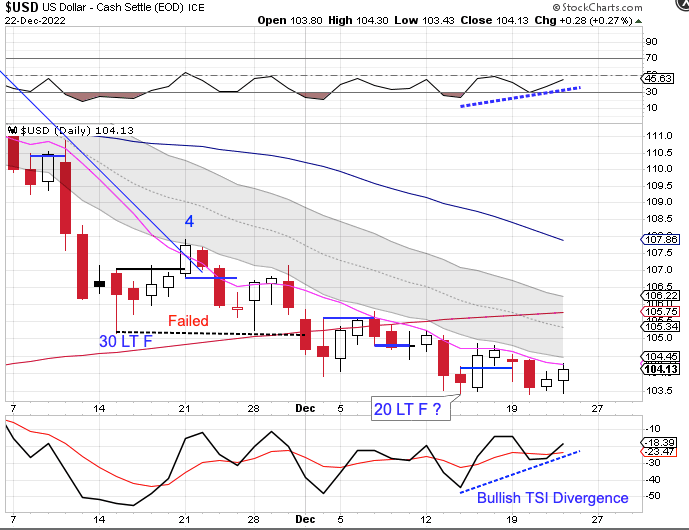
The dollar printed its lowest point on day 20, placing it in the early part of its timing band for a DCL. The bullish divergence on the oscillator point towards day 20 being the DCL. A close above the 10 day MA would signal the new daily cycle.
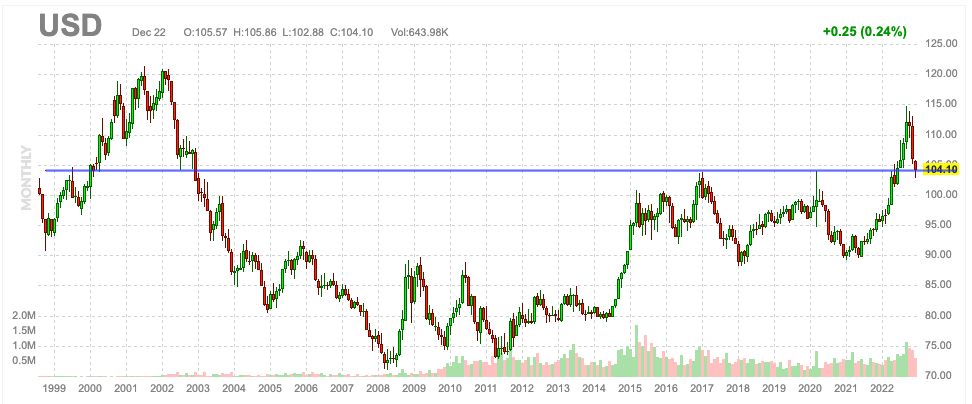
The dollar is sitting at a multi decade support/resistance level. And with the dollar being in its timing band for a yearly cycle low, a new daily cycle could result in a new yearly cycle.
In my Special Report: Headwinds/Tailwinds we will look at the longterm dollar cycle and how it could act as a headwind or, potentially, a tailwind.
Through Saturday, I am offering a special 6 week trial subscription, along with the Special Report: Headwinds/Tailwinds for $15. Your 6 week trial subscription you will give you full access to the premium site which includes:
1) The Weekend Report, which is posted usually Saturday mornings. It discusses Dollar, Stocks, Gold, Miners, Oil, & Bonds in terms of daily, weekly and yearly cycles – Which includes the Likesmoney Cycle Tracker.
2) The Mid-Week Update. Posted on Wednesday’s is a review of the daily charts for the above mentioned asset classes.
3) The Weekend Updates take a look of the daily & weekly charts of GBTC, DAX, GYX, NATGAS & XLE.
4) Weekly Update of the Bullish Percentile Bingo
5) Frequent updates of my proprietary FAS Buy/Sell Indicator
The goal of the Weekend Report is to develop an on-going framework of expectations using cycle analysis.

Leave a comment