The Dollar

The dollar printed its lowest point on Thursday, following the day 10 peak. The swing low that formed on Friday signals an early daily cycle low.
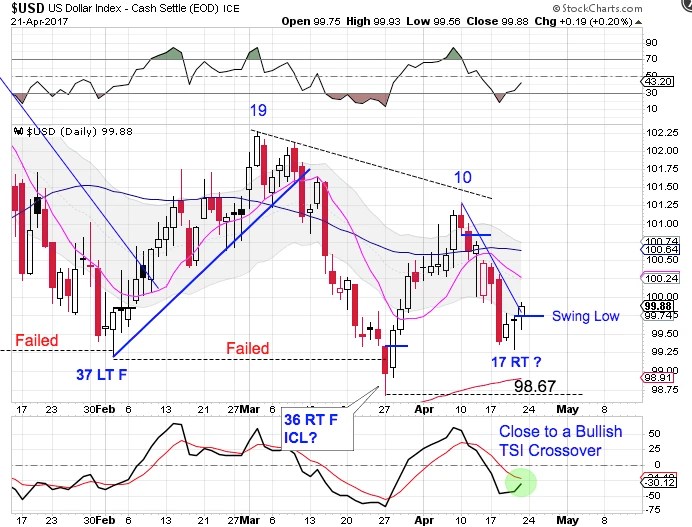
The previous 7 daily cycles have averaged 32.5 days/cycle so we are expecting more downside to this daily cycle. However yearly chart* shows that the dollar is sitting right on the yearly cycle trend line… which could act as support for a shortened daily cycle low. And if Thursday turns out to be the daily cycle low, then that would indicate that March 27th hosted the ICL.
*Editor’s note:
The weekly, yearly, 3 year and 15 year super cycle analysis is a regular part of the Weekend Report.
Stocks

Stocks continue to be suppressed by the declining trend line.
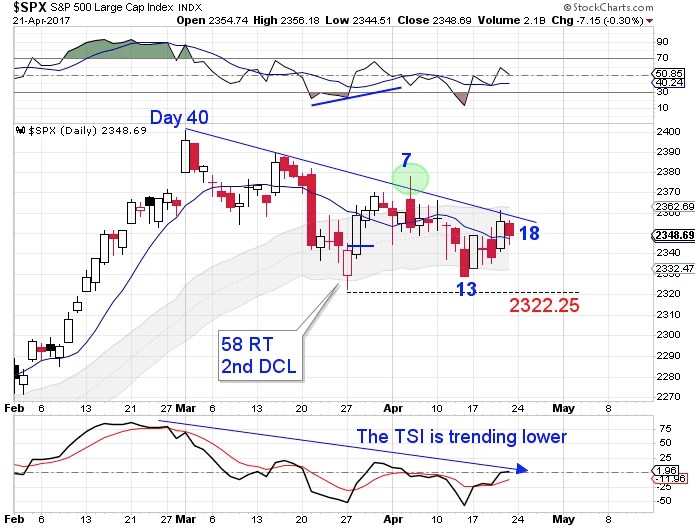
The current daily cycle peaked on day 7. Stocks closed below the lower daily cycle band last Friday, day 13. This signals that the intermediate cycle is in decline.
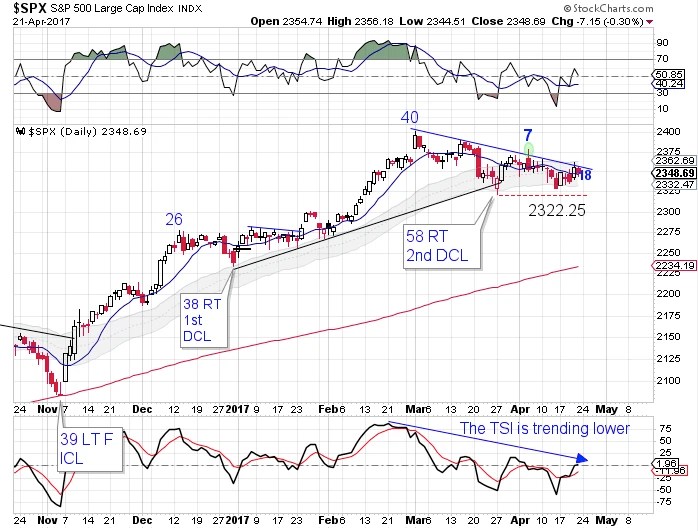
The previous daily cycle was stretched at 58 days. Since cycles tend to balance a stretched cycle with a shortened cycle, we could see a shortened daily cycle here with stocks possibly printing a DCL once 2322.25 is breached.
The entire Weekend Report can be found at Likesmoney Subscription Services
The Weekend Report discusses Dollar, Stocks, Gold, Miners, Oil, & Bonds in terms of daily, weekly and yearly cycles.
Also included in the Weekend Report is the Likesmoney CycleTracker
For subscribers click here.
You can email me at likesmoney@gmail.com to receive a sample copy of the Weekend Report

Leave a comment