 http://postimg.org/image/4cz704un1/
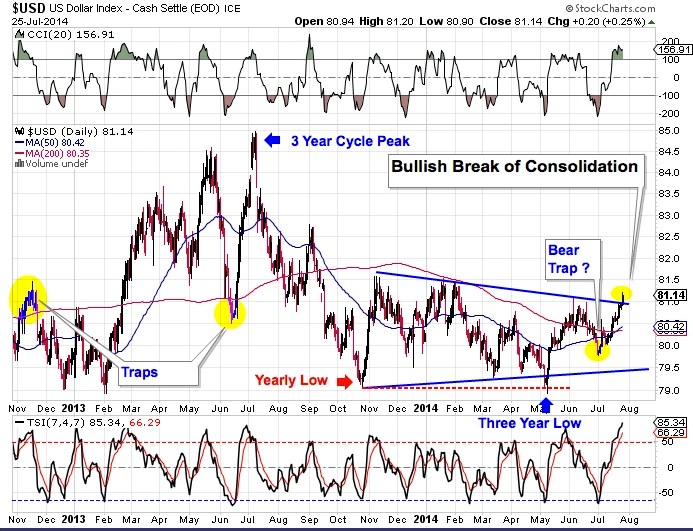
The dollar has a history of breaking through an important moving average only to reverse and trend the other way.
 http://imageshack.com/a/img537/340/4hoPjg.jpg
The daily cycle low printed on 7/1/14 looks to be a trap. This fits well with May hosting the three year cycle low. The break of the upper trend line provides further evidence that May hosted the three year low.
But this is only part of the picture. This three year cycle is only part of a much larger cycle I term the 15 year Super Cycle.
The full report is available to subscribers.
I would like to make this report available here. The Special Dollar Report and a complementary 1 month subscription to the Likesmoney Premium Site is available for $30.
The complementary subscription will give you full access to the premium site. It includes:
1) The Weekend Report, which is posted usually Sunday mornings. It discusses Dollar, Stocks, Gold, Miners, The CRB Index, & Bonds in terms of daily, weekly and yearly cycles – Which includes the Likesmoney Cycle Tracker.
2)The Mid-Week Update. Posted on Wednesday’s– This is a review of the daily charts for the above mentioned asset classes.
3)Weekend Update look of the daily & weekly charts of Corn & DBA
4)Weekly Update of the Bullish Percentile Bingo
5) Frequent (just about daily) updates of my proprietary FAS Buy/Sell Indicator
The goal of the Weekend Report is to develop an on-going framework of expectations using cycle analysis.
I have also started a terminology section to explain some of the terms used.
For the Likesmoney Special Dollar Report and 1 Month Trial Subscription click here.

Leave a comment