![]()
The Dollar
 http://postimg.org/image/8jp4ugbcv/
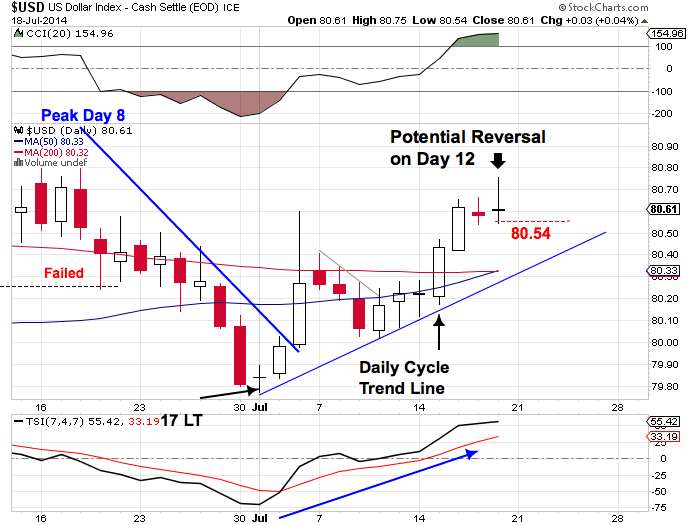
This week saw the dollar rebound off the daily cycle trend line. The dollar broke through both the 50 MA and the 200 MA printing a new daily cycle high on Friday.
 http://imageshack.com/a/img673/5540/83bff7.jpg
However, the reversal candle left behind on Friday suggests a daily cycle decline is imminent.
 http://imageshack.com/a/img745/7638/ee49ed.jpg
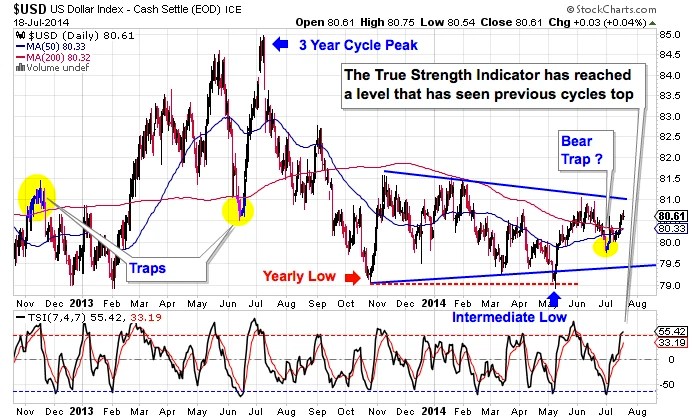
Two points from the longer view daily chart:
1) The dollar is encroaching the upper stem of the triangle consolidation.
2) The True Strength Indicator has reached a level that has seen other daily cycles roll over.
Stocks

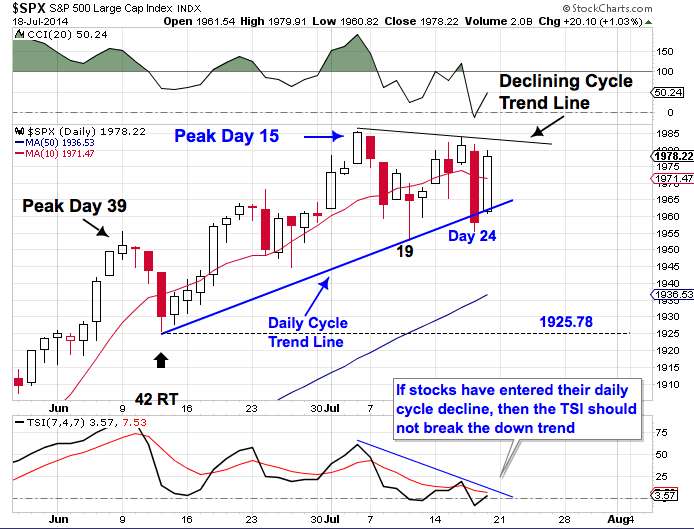
The daily equity cycle peaked on day 15. It lost the day 10 MA as it declined into a half cycle low on day 19. The subsequent rally out of the half cycle low has failed to make a new daily cycle high.
 http://imageshack.com/a/img536/3758/db592e.jpg
Stocks have been volatile since emerging from the half cycle low. The big down day on day 24 may have set the declining cycle trend line at day 23. Stocks are now five days shy of their timing band for a daily cycle low. If day 15 stands as the cycle peak, then it is quite likely that this cycle will result in a left translated failed daily cycle. A failed daily cycle should see stocks break below the previous daily cycle low of 1925.78.
The entire Weekend Report can be found at Likesmoney Subscription Services
The Weekend Report discusses Dollar, Stocks, Gold, Miners, The CRB Index, & Bonds in terms of daily, weekly and yearly cycles.
Also included in the Weekend Report is the Likesmoney CycleTracker
To subscribe: http://likesmoneysubscriptionservices.wordpress.com/
For subscribers: the full Weekend Report can be found at Likesmoney Subscription Services at http://likesmoney.wordpress.com/
You can email me at likesmoney@gmail.com to receive a sample copy of the Weekend Report

Leave a comment