
The dollar appeared to have left behind a 32 day daily cycle low on Thursday with the swing low printed on Friday.

Monday saw the dollar close lower, back-testing the declining trend line. A break above Friday’s high would provide clear and convincing evidence of a new daily cycle.
The big picture still has the dollar declining into a yearly cycle low. So unless this is an early intermediate
cycle low, the impending new daily cycle should peak by day 8. and then continue lower.
Bonds also appear to have left behind a daily cycle low on Friday.

Monday saw bonds higher and testing the declining cycle trend line. A break above that trend line would signal Friday was a right translated 17 day- daily cycle low.
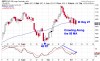
Stocks are still seeking out their daily cycle low by continuing the crawl pattern along the 50 MA.

Monday was day 27 for the daily equity cycle. Stocks still have 3 more days to go to enter their timing band to print a daily cycle low which could last up to three more weeks. Stocks did close below the 50 MA, which was the lowest close since the daily cycle peaked. Perhaps this is signaling that the crawl pattern will break lower.


Leave a comment