
I wanted to share with you a few charts that I have been watching.
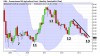
First off is the yearly chart of Agriculture as represented by the ETF DBA.

Like other commodities, agriculture has been in a extended decline into a yearly cycle low. At 13 months, agriculture is in the timing band for a yearly cycle low. Since July printed a lower monthly low, the earliest a monthly swing low can form will be August. A break above 25.40 forms a monthly swing low.

Drilling down to the weekly chart we see that DBA printed a 33 week low three weeks ago. A weekly swing low has formed. A break above the declining trend line will signal a new yearly cycle.
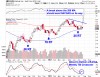
NATGAS is also waiting on a declining weekly trend line break.

The intermediate cycle for NATGAS tends to run 18 – 21 weeks. A weekly swing low was formed off the low three weeks ago. A break above the declining trend line confirms a new intermediate cycle.

There are 2 things that I want to point out by taking a closer look at the weekly chart. First is the weekly TSI is about to deliver a bullish crossover. Second is that price is currently caught between the 50 MA and the 200 MA. A break above the 200 MA will be the signal that NATGAS is on its way to break above the declining trend line to confirm a new intermediate cycle.
I will continue to keep these on my radar …


Leave a comment