
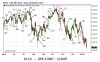
The equity cycle prints a major market bottom about every 4 years.

The 2009 four year cycle was shortened to 33 months due to the financial crisis and QE. The current 4 year cycle stands at 52 months. It makes sense that this current four year cycle is running a little long to balance out the previous shortened cycle. However, equites are in the timing band for a 4 year cycle low.
On to the yearly cycle

Stocks are currently on month 13 of the yearly cycle. The yearly equity cycle averages a yearly cycle low every 11 months. A break of the accelerated trend line confirms the yearly cycle decline has begun. A failed intermediate cycle signals the yearly cycle decline. So on to the intermediate cycle.

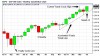
The intermediate equity cycle peaked on week 27. There is a clear and convincing trend line break on week 31 with a low printed on week 32. The rally out of the week 32 low breaks above the declining trend line. This looks like an intermediate cycle low has just been left behind. If so, then we would expect that the termination of this cycle will lead to the yearly cycle low. Therefore we expect this new intermediate cycle to form as a left translated weekly cycle.

There is just one thing, the was never a failed daily cycle to conclude this intermediate cycle. Otherwise this decline satisfies all other criteria for an intermediate cycle decline. So we need to be open to the possibility of this current daily cycle being the fifth daily cycle instead of the first daily cycle. If the current daily cycle prints as a left translated, failed daily cycle then it was likely the fifth daily cycle. If it forms as a right translated daily cycle, then it is likely the first daily cycle of a new intermediate cycle.
If this is the 5th daily cycle then an intermediate cycle low ( and yearly low) would be due in 4 to 6 weeks. If this is actually the first daily cycle, then the intermediate and yearly cycle low would be expected at the end of this intermediate cycle in about 17 – 21 weeks.
Selling on Strength numbers can also indicate if an intermediate and yearly decline is likely.

I mapped out the Selling on Strength Numbers for the current intermediate cycle. Out of the November 2012 intermediate low you will notice that the SPY having 3 SOS days in each of the first two months. Then it shifted to 4 – 5 SOS prints per month the next couple of months. The final two months leading into the intermediate cycle peak saw 8 SOS days in April and 9 SOS days in May. Only three printed in June and so far only three has printed in July. The intensity of the current SOS days leads me to think that a intermediate cycle low just got left behind us.
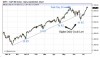
So I thought that it would be interesting to compare where we are to the last major market top in 2007.

So I want to look at the SOS numbers at the market peak of 2007.

What I notice right away is the intensity of the SOS days. We see that there are 7 to 9 SOS days per month leading into the 2007 peak. The other big thing that I notice is the size of the SOS days. The majority of the days leading into the 2007 peak were triple digit SOS days. There was even one at four digits — 1615. That one day was one trillion, six hundred fifteen million Selling on Strength. These are really big numbers.
Comparing the 2007 numbers to the current numbers suggest that the Big Boys haven’t yet left the party …


Leave a comment