
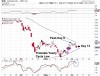
The daily Miner cycle peaked on Monday, which was day 9. Then they traded sideways until Thursday where they tested the declining 50 MA.

Friday was a clear rejection and it looks like the Miners heading into a daily cycle low. We are likely to see the Miners fill the gap at 263.84 during this correction. If this is a daily cycle correction, then the Miners will need to print a daily cycle low before day 18 in order to avoid forming as a left translated daily cycle.
In the short term we can expect a daily cycle correction for the Miners. But I believe a major opportunity is just around the corner. The signal is when the Miners confirm a new yearly cycle.

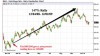
May was month 12 for the yearly Miner cycle. A monthly Doji formed along with a monthly Bollinger Band breach. This very likely marked the yearly cycle low. A break above 291.07 forms a monthly swing low. And a break above the declining monthly trend line confirms a new yearly cycle.
The Gold Miners Bullish Percent Index recently printed a double bottom.

The BPGDM has never printed a double zero percent reading before. It has printed a single zero percent reading one other time …

And lets see how the Miners responded …

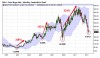
So I mentioned earlier that currently the monthly Miner’s chart printed a monthly Bollinger Band crash which is in the timing band for a yearly cycle low. Let’s look at otherr times that the Miners had a monthly Bollinger Band crash in the timing band for a yearly cycle low.

Looking at the past 15 years there are only 3 other times the Miners had a monthly Bollinger Band crash. They just happen to coincide with the three year cycle lows. The resulting rallies from these lows coupled with a monthly Bollinger Band crash tacked on anywhere from 142% to 338%.
And let’s look at one other indicator.

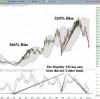
The monthly Trend Strength Indicator indicates when something is oversold or overbought. Looking at the monthly chart for the Mines above we see that the monthly TSI has been this oversold only twice before. The first time saw a gain of 546% and the second time at this level saw the Miners gain 324%.
So by looking at three different indicators we see that the Miners are historically oversold. And each one of these indicators marked levels close to or at the bottoms where the results were triple digit rallies.
If the Miners haven’t bottomed,they are close.
Once a monthly swing low does print, I think that will turn the switch…

For this week I will offer a 1 month trial subscription of the Weekend Report.
$15 for one month allows you access to the entire Likesmoney Weekend Report Suite.
Included is the Weekend Report Suite:
My notebook on Miner Studies, Dollar Studies, Equities Studies, and Corn Studies
There is also my proprietary FAS Buy/Sell Indicator and the Bullish Percent Index Bingo
Click here for to signup for a 1 month trial:
https://www.paypal.com/cgi-bin/webscr?cmd=_s-xclick&hosted_button_id=KBYHDKHFX66WG
For subscribers: the full Weekend Report can be found at Likesmoney Subscription Services at http://likesmoney.wordpress.com/


Leave a comment